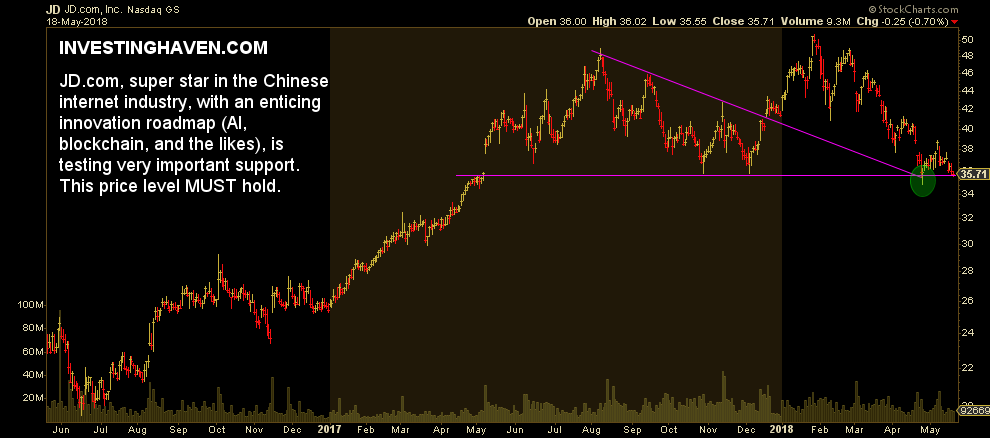
JD.com (JD) is one of the largest online retailers in the world. It is the largest online retailer in China, and growing even faster than Amazon, with a market cap of close to $60B. JD.com’s share price, symbol JD, is trading at 52 week lows. This is a typical situation in which an investor has to make a decision: is this a buy opportunity or is this stock in a strong downtrend (implying investors should stay away for a while)? This is how smart investors look at such a scenario.
First, note that our research team recently wrote 4 Online Retail Stocks That Look Bullish In 2018 in which JD was tipped as a top stock. Everyone in InvestingHaven’s research team is still convinced it is the case, this is why.
JD is trading at 52 week lows, after a 31% retracement since it topped in January of this year. That is a serious correction. So per the rules of smart investors it is mandatory to check several distinct data points to understand whether this is one those exceptional buy opportunities or whether this is the next ‘crash in motion’.
JD: Giant internet stock in China with great fundamentals and financials
These are the data points that are relevant for stock investors that are looking at JD:
- Financials:
- Revenue growth from $11.2B in 2013 to $53.6B in 2017
- EPS from $0.48 loss in 2013 to $0.01 in 2017
- hardly any new shares were created in the last 2 years
- last quarter: almost 50% more revenue QoQ and $0.17 profit per share
- Fundamental conditions:
- The Chinese economy continues to grow strongly
- E-commerce in China is booming (core activity of JD.com as it is the biggest direct online seller in China)
- JD has been rapidly gaining market share on its larger rival, seeing its share of the business-to-consumer market grow from 17.7% to 32.9%.
- Stock trends in its industry and country:
- China’s stock market is consolidating in a long term powerful bull market, as explained in China Stock Market Did Something Important in May 2018
- Large caps in China are outperforming the rest of the stock market.
Moreover, JD.com is strong in innovation to ensure future growth. They are focused on AI (artificial intelligence) to strengthen their operations, and data driven advertising to be more efficient towards the advertisers on their platform.
If you compare JD.com with Amazon: JD has a 40% YoY growth compared to 33% of Amazon (source).
So, taking all data points into account, as well as the chart of JD shown below, it is clear that this is a buy opportunity more than anything else. However, the chart of JD suggests this stock is trading at critical support right now.
How to play this? The odds favor a bullish move. However, current support should hold. So smart investors are ready to pick up shares of JD as soon as the market confirms that support at $35 holds strong. A great entry point is the $38 price level, again, only after support at $35 has held.
This is a classic case which needs some attention, and weekly followup, before engaging in a trade. Patience, as said many times, will be rewarded, and JD is a textbook example to illustrate this.


