Investing Haven
No Result
View All Result
Gold Silver Investing >>
CRYPTO INVESTING >>
  • 2025 Forecasts
    • 10 market predictions
    • Dow Jones forecast
    • S&P 500 forecast 2025
    • Nasdaq prediction 2025
    • Best altcoins to buy
    • Best crypto to buy now
    • Which crypto will explode
    • 15 crypto forecasts 2025
    • Which precious metal to buy
  • Silver
    • Silver prediction 2025 – 2030
    • Will silver exceed $30?
    • When will silver hit $50?
    • Can silver hit $100?
    • Silver shortage
    • 50-year silver chart
    • Silver bullish reversal
    • Silver seasonality charts
    • How to invest in silver
  • Gold
    • Gold prediction 2025 – 2030
    • Will gold set new ATH?
    • Will gold hit $3,000?
    • Can gold hit $10,000?
    • Gold chart 10 years
    • Gold chart 50 years
    • Gold chart 100 years
    • Gold silver ratio
    • Gold seasonality charts
  • Commodities
    • Coffee forecasts
    • Sugar forecasts
    • Nickel forecasts
    • Lithium investing
  • Crypto forecasts
    • BTC prediction 2025 – 2030
    • ETH prediction 2025 – 2030
    • SOL prediction 2025 – 2030
    • XRP prediction 2025 – 2030
    • XLM prediction 2025 – 2030
    • BNB prediction 2025 – 2030
    • ADA prediction 2025 – 2030
    • AVAX prediction 2025 – 2030
    • KAS prediction 2025 – 2030
    • NEAR prediction 2025 – 2030
    • BCH prediction 2025 – 2030
    • LINK prediction 2025 – 2030
    • DOT prediction 2025 – 2030
    • SUI prediction 2025 – 2030
    • ICP prediction 2025 – 2030
    • LTC prediction 2025 – 2026
    • STX prediction 2025 – 2030
    • DOGE prediction 2025 – 2030
    • SHIB prediction 2025 – 2030
    • PEPE prediction 2025 – 2030
    • FLOKI prediction 2025 – 2030
    • WIF prediction 2025 – 2030
    • ONDO prediction 2025 – 2030
  • News
    • Crypto news
    • Commodities
  • Login
Investing Haven
No Result
View All Result

Kush Bottles Rises 3-Fold After Triangle Breakout – This Is Why Chart Analysis Matters

Taki Tsaklanos by Taki Tsaklanos
February 24, 2019
in Breakout / Breakdown

Home » Breakout / Breakdown » Kush Bottles Rises 3-Fold After Triangle Breakout – This Is Why Chart Analysis Matters

2k
VIEWS
Share on FacebookShare on Twitter

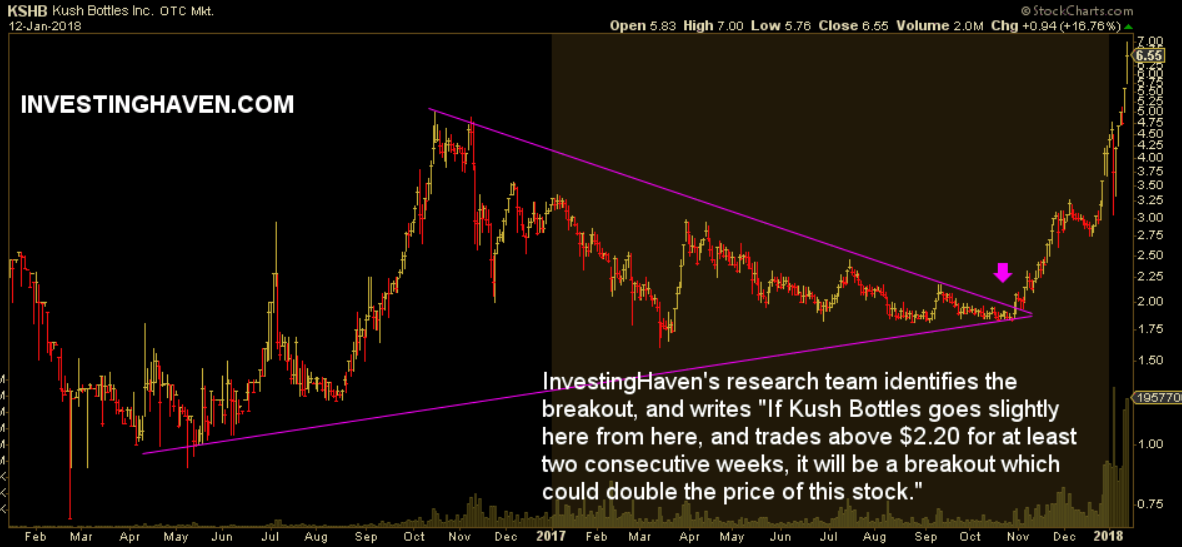
This article is educational. We analyze one great case which highlights the importance of chart analysis. In particular it is a triangle breakout, a textbook pattern in chart analysis, which is very high reward / low risk setup for investors. Case in point: Kush Bottles, symbol KSHB. Note: InvestingHaven’s research team noticed this setup back in October when the stock was trading below $2 while it touched $7 this week, see this article Cannabis Stock Kush Bottles, Packaging Producer, On The Verge Of A Big Breakout.

Kush Bottles is specialized in manufacturing packaging for the cannabis industry. Whether there is a moral aspect to investing in the cannabis industry is not relevant in today’s discussion.

The point is that Kush Bottles had an amazing setup on its chart: a triangle pattern. That pattern was in the making for almost 2 years which is an amazingly important fact. The longer it takes to create a pattern the stronger the move once it breaks out or breaks down.

This is what we wrote back in October:

Moreover, the chart looks awesome. Kush Bottles is trading at a big breakout level, and is doing so on rising volume. In addition, it has been consolidating since early this year, a 9 month period, in which it respected support at $1.80.

If Kush Bottles goes slightly here from here, and trades above $2.20 for at least two consecutive weeks, it will be a breakout which could double the price of this stock.

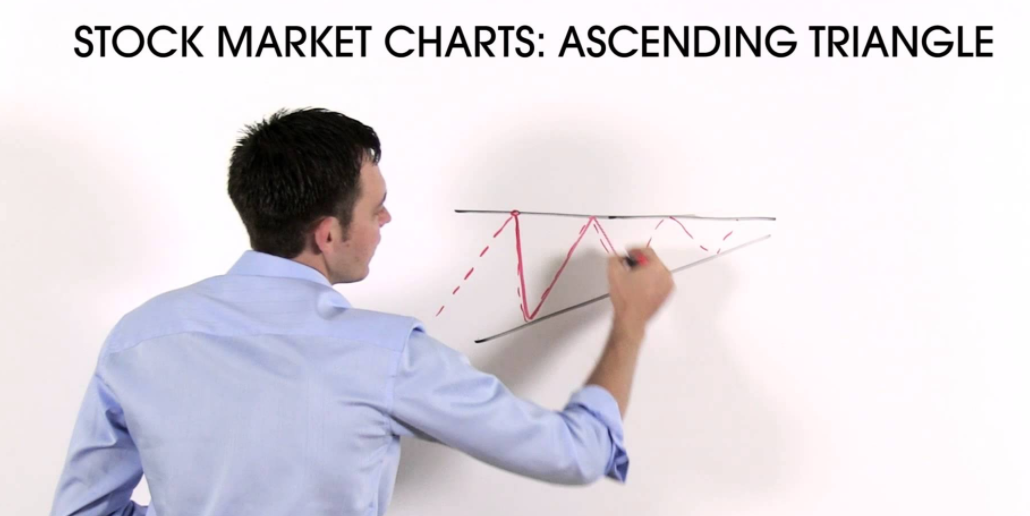
The way to interpret a triangle pattern is highlighted in the above quote. Sellers were not able to push this stock below a certain price point, in this case $1.60, for more than a year. However, buyers were not able to push this stock above falling resistance neither. That is exactly what the triangle pattern stands for, and how buyers/sellers collectively create this pattern.

Once the price of a stock reaches to the apex of the triangle it is ‘forced’ to choose a direction: Either up or down. That is when a breakout (up) or a breakdown takes place.

That is how we were able to determine that Kush Bottles would start trending. The timing was really perfect. The fact that this stock would trend higher (as opposed to a breakdown) was based on the fact that sellers were not able to get this stock below $1.60 for more than a year.

Another great case of a triangle breakout pattern, maybe even greater than the one outlined above, is emerging markets. We believe the case is stronger because the setup of the triangle pattern took 9 full years! That is very unusual, and its setup was a clear indication for us that emerging markets would start a mega-breakout, which they did recently. Read our article from last June: Emerging Markets Testing Mega-Breakout, About To Start Strong Bull Market. This is the quote from that article:

On the chart of emerging markets (EEM ETF) the most important price point is 42 points. Why? As the secular trendline (purple line) suggests this is the resistance of the consolidation which took an amazing 9 years will. As explained in our Emerging Markets forecast for 2017 we observed this already a year ago.

Of course, a triangle pattern is not the only indicator which is important to consider. It is mandatory to always look at a set of indicators: fundamental value of a market, sentiment, industry. The point is this: ultimately, the chart provides the timing, and reveals upfront which markets are setting up for a new bullish or bearish trend while fundamental analysis / sentiment / industry market trends provide the indication of which direction the new trend will be going.

kush bottles stock

10-YEAR ANNIVERSARY OFFER: InvestingHaven.com celebrates 10 years. Temporarily, you can enjoy a discount on our premium gold/silver and crypto reports. Or you can become a VIP member. Go to our anniversary deals >>
Receive our weekly newsletter.

premium service SP-500 premium service trade alerts premium service crypto teaser 

No related posts.

Tags: KSHB
Taki Tsaklanos

Taki Tsaklanos

Taki has +15 years of experience in global markets. He is passionate about forecasting markets - he calls it THE ART OF FORECASTING. His analysis methodology is unique and effective, yet easy to understand; it is based on chart analysis combined with intermarket / fundamental / sentiment analysis. His work appeared on major financial outlets like FinancialSense, MarketWatch,Twitter: twitter.com/investinghaven

Leave a Reply Cancel reply

Your email address will not be published. Required fields are marked *

Connect with InvestingHaven

Receive top notch forecasts for free.

*We hate spam as you do.

Site Navigation

  • RSS Feed
  • About us
  • Advertising
  • Sponsored Content Policy
  • Mission 2026
  • Sitemap
  • Privacy & Disclaimer
  • Terms of Service
  • Contact Us
investing haven logo

Precious metals market analysis including gold and silver price predictions. Crypto market analysis including highly accurate BTC ETH SOL XRP forecasts.

Copyright © 2025 InvestingHaven

Login to your account below

Forgotten Password?

Fill the forms bellow to register

All fields are required. Log In

Retrieve your password

Please enter your username or email address to reset your password.

Log In

Receive top notch forecasts for free.

*We hate spam as you do.

    InvestingHaven.com honours your privacy. Read our Privacy Policy

    No Result
    View All Result
    • News
    • 2025 Forecasts
      • 10 market predictions
      • Dow Jones forecast 2025
      • S&P 500 forecast 2025
      • Nasdaq prediction 2025
      • Best crypto to buy now
      • Which crypto will explode
      • Best altcoins to buy
      • 15 crypto forecasts 2025
      • Which precious metal to buy
    • Silver articles
      • Silver prediction 2025 – 2030
      • Will silver exceed $30?
      • When will silver hit $50?
      • Can silver hit $100?
      • Silver shortage
      • 50-year silver chart
      • Silver bullish reversal
      • Silver seasonality charts
      • How to invest in silver
    • Gold
      • Gold prediction 2025 – 2030
      • Will gold set new ATH?
      • Will gold hit $3,000?
      • Can gold hit $10,000?
      • Gold chart 10 years
      • Gold chart 50 years
      • Gold chart 100 years
      • Gold silver ratio
      • Gold seasonality charts
    • Commodities
      • Sugar forecasts
      • Coffee forecasts
      • Nickel forecasts
      • Lithium investing
    • Crypto news
    • Crypto forecasts
      • BTC prediction 2025 – 2030
      • ETH prediction 2025 – 2030
      • SOL prediction 2025 – 2030
      • XRP prediction 2025 – 2030
      • XLM prediction 2025 – 2030
      • BNB prediction 2025 – 2030
      • ADA prediction 2025 – 2030
      • AVAX prediction 2025 – 2030
      • KAS prediction 2025 – 2030
      • NEAR prediction 2025 – 2030
      • BCH prediction 2025 – 2030
      • LINK prediction 2025 – 2030
      • DOT prediction 2025 – 2030
      • SUI prediction 2025 – 2030
      • ICP prediction 2025 – 2030
      • LTC prediction 2025 – 2026
      • STX prediction 2025 – 2030
      • DOGE prediction 2025 – 2030
      • SHIB prediction 2025 – 2030
      • PEPE prediction 2025 – 2030
      • FLOKI prediction 2025 – 2030
      • WIF prediction 2025 – 2030
      • ONDO prediction 2025 – 2030
    • Premium Crypto Alerts
    • Premium services

    Copyright © 2025 InvestingHaven