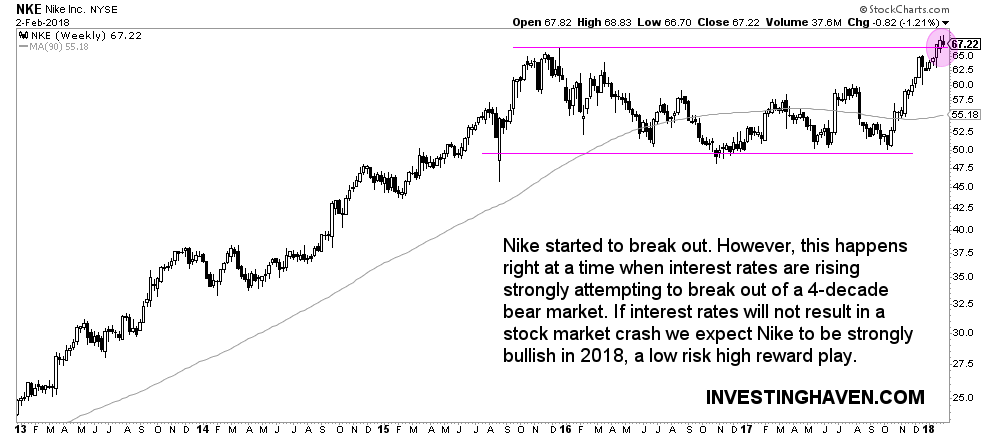
Ever thought of buying stocks of Nike rather than buying a new pair of Nike shoes? That would not have been a very profitable trade in the last 2 years but things could be totally different in 2018. In fact, the chart of Nike signals that its stock could be strongly bullish in 2018, and investors could be looking at a strongly profitable investment.
Nike has a market cap of $110B at the moment of writing. Its financials are very solid which makes us conclude it is a great stock:
- Earnings per share of 2.31 (projected 2.67 in 2018)
- Price earnings ratio of 29x (on the high side but projected to go lower in 2018)
- Price sales ratio of 3.14x
- Short float ratio of 2 percent
- Solid annual growht in top line financials, first and foremost revenue and profits, see Google Finance.
Nike’s chart reflects its strong fundamentals. Essentially, we are looking at a breakout which took place in January of 2018. In plain simple terms, after the strong rally between 2013 and 2015, which took Nike’s price from $20 to $65, the stock took a rest of 2 years which is a very healthy situation. Such a consolidation period is great to ‘fill the battery’ (proverbially), and ready for the next leg higher.
That is how we read the chart of Nike. After a well-deserved pause of 2 years this stock is now ready to move (sharply) higher in 2018 and beyond.
The only caveat on this chart, similar to any other breakout on any chart, is that Nike’s stock price can come back and test the breakout level which is $66. Investors cannot exclude a false breakout which means that the market isn’t ready to push this stock higher (yet) in which case patience is required.
Our view is that this stock’s chart as well as its fundamentals look solid. We believe this stock could be strongly bullish in 2018 provided the $66 level holds strong..


