Investing
Haven
No Result
View All Result
Sunday, August 7, 2022
  • Login
  • Premium Services & Login
  • 2022 Forecasts
  • Commodities & Gold
  • Stocks
  • Crypto
  • Mission 2026
Crypto investing >>
Investing
Haven
  • Premium Services & Login
  • 2022 Forecasts
  • Commodities & Gold
  • Stocks
  • Crypto
  • Mission 2026
No Result
View All Result
InvestingHaven
No Result
View All Result

Silver: a Bearish And a Bullish Chart

by Taki Tsaklanos
January 20, 2018
in Breakout / Breakdown
0
Tags: SILVERSLV
Silver price
1.9k
VIEWS
Share on FacebookShare on Twitter

In our silver price forecast 2018 we admitted,in all honesty, having a tough time forecasting a specific target. We ended our article saying that we would update readers “once we have new insights.” We believe we are very close to a resolution. Interestingly, the answer really depends on the timeframe of the chart, as there is a bearish and a bullish version of the chart. Let’s explore the silver investing thesis.

The sentiment around silver (SILVER) is neutral in mainstream media. A quick look at silver price news article reveals that literally nobody has any interest in silver investing (google news). That, of course, is a great environment for a new bull market to arise.

Not that we consider google news the primary indicator for an investment. It is a secondary data point which should be interpreted together with the chart primarily, and, if relevant, fundamental value.

In our silver forecast we identified the following critical price levels:

  • As long as silver does not rise above $21 it has not broken out in which case it is trendless or bearish.
  • If silver falls below $16 (and stays below 16 for at least 3 consecutive weeks) it is bearish.
  • Between $16 and $21 silver is neutral.
  • Moreover, $14 is a major price level as it marks the lows of the last 9 years. If silver sets a major double bottom between 14 and 15 in 2018 then (only then) will we become very bullish for the long term.

Silver’s weekly chart shows a neutral trend with a bearish bias. See below.

silver chart

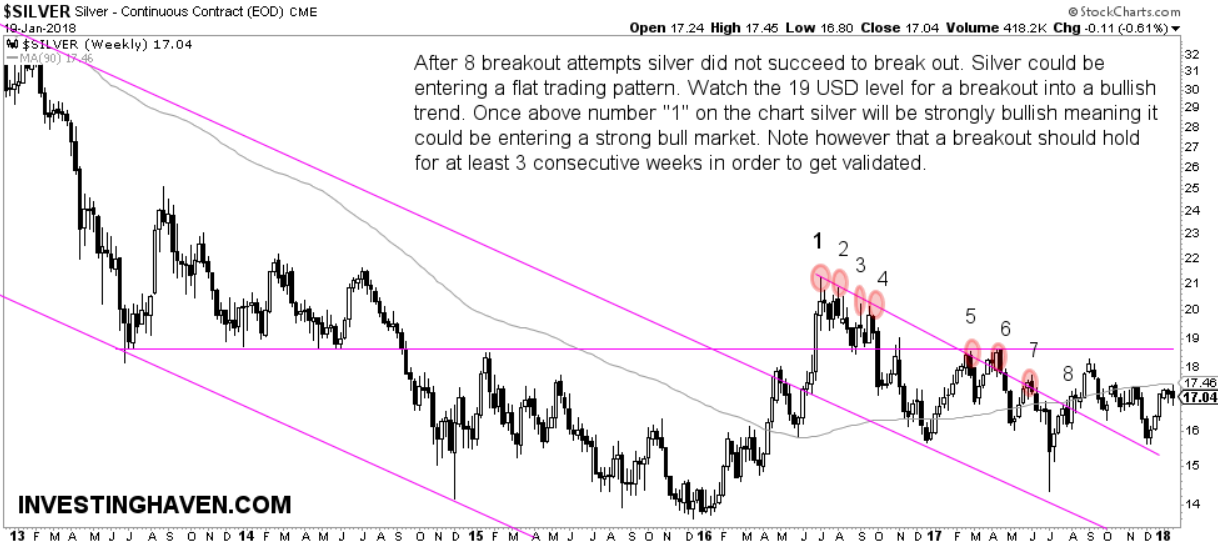
However, it becomes interesting once we zoom out.

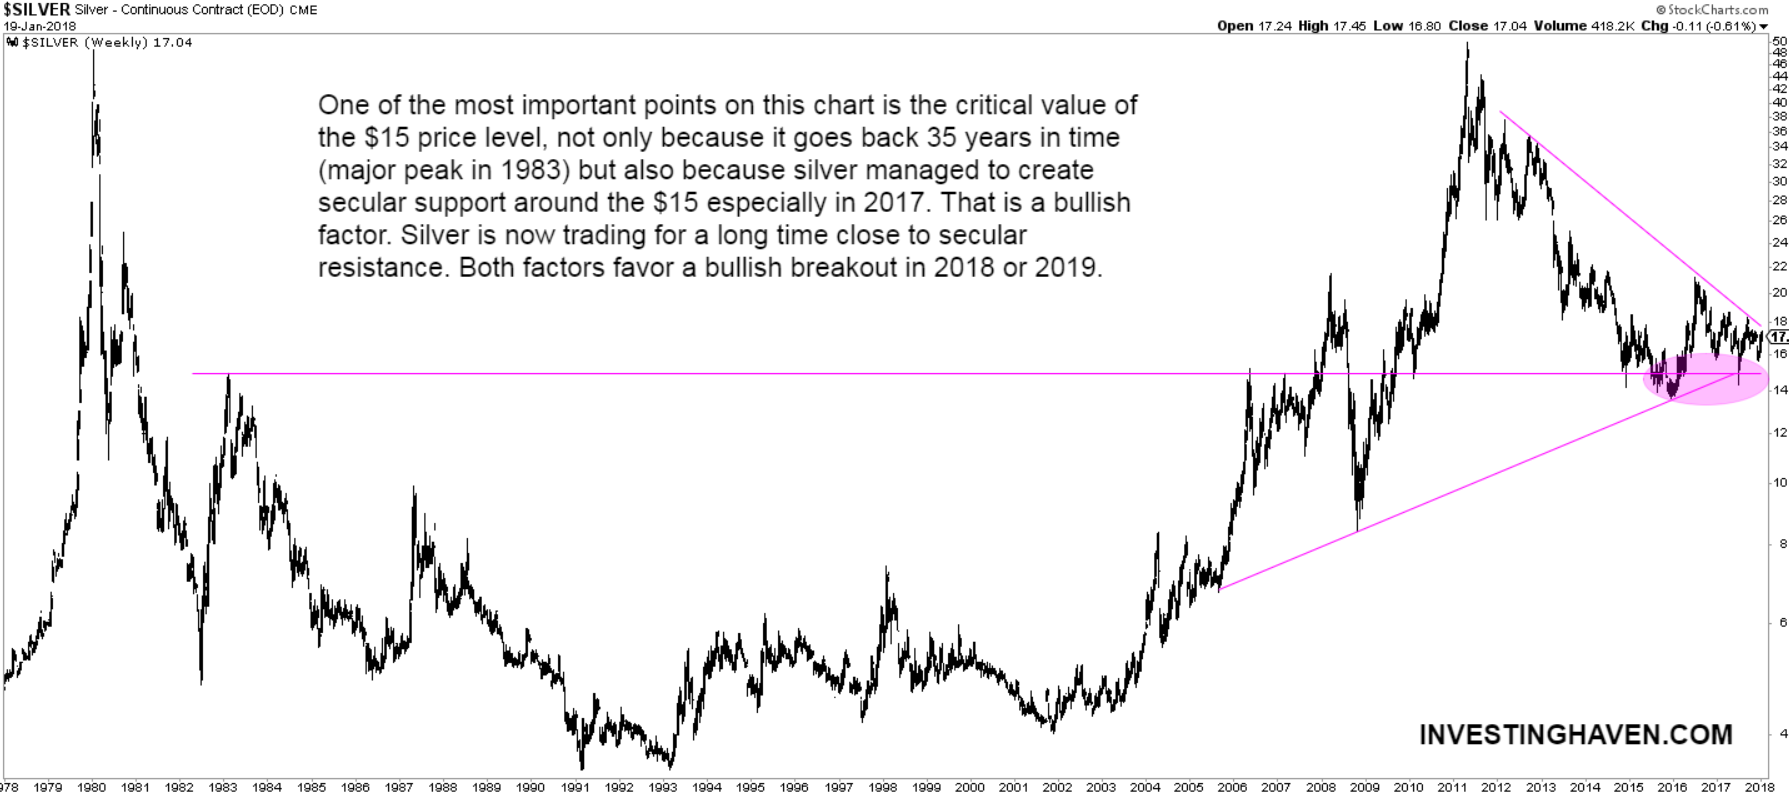
The monthly silver price chart shows a totally different picture. And THAT is the reason why it is SO important to always check higher level timeframes when studying markets before taking any position.

The monthly chart shows the importance of $15. More importantly, the way the silver price has ‘behaved’ in recent years and months suggests that $15 has become a secular support level. Now that is important information for an investor to work with.

Given the unusually long time that silver is now trading close to, and testing, secular resistance, it suggests to us that it is a matter of time until silver breaks out of its 7 year bear market.

For now, we still stick to the conclusion of our forecast:

Once silver starts rising in the first months of 2018 (seasonal strength) we are closely watching the $21 area as secular resistance.

We follow the gold and silver market very closely, and will update readers immediately once we believe a bullish breakout takes place. As always, although we are very skeptical on gold and silver until the end of last year, we are open for the opposite scenario, and the first ones to accept we were thinking in the ‘wrong’ direction.

silver chart

  premium service trade alerts   premium service trade alerts   premium service crypto teaser  
Receive top notch forecasts for free.

*We hate spam as you do.

  premium service trade alerts   premium service trade alerts   premium service crypto teaser  
Receive top notch forecasts for free.

*We hate spam as you do.

Taki Tsaklanos

Taki Tsaklanos

Taki has +15 years of experience in global markets. His methodology is unique and effective, yet easy to understand; it is based on chart analysis combined with intermarket / fundamental / sentiment analysis. His work appeared on major financial outlets like FinancialSense, MarketWatch, ... Email: taki.tsaklanos@gmail.com. Twitter: twitter.com/investinghaven

Latest

semiconductor stocks

This Semiconductors Segment Is Outperforming The Market… And Will Continue To Do So

July 31, 2022
lithium mining stocks

The Only Commodity Not Impacted In 2022, Currently Right Below ATH

July 31, 2022
staglation

Gold’s Chart Suggests Stagflation Is Here To Stay In 2023 And Beyond

July 31, 2022
btc price forecast

Will Bitcoin Move Back To 30k?

July 31, 2022

Connect with InvestingHaven

Receive top notch forecasts for free.

*We hate spam as you do.

Categories

  • Premium Services & Login
  • 2022 Forecasts
  • Commodities & Gold
  • Stocks
  • Crypto
  • Mission 2026

Site Navigation

  • RSS Feed
  • About us
  • Sitemap
  • Privacy & Disclaimer
  • Terms of Service
  • Contact Us
Investing
Haven

Top notch forecasting with gold price forecast, many stock predictions, cryptocurrency charts. Many investing tips and crypto market analysis.

Copyright © 2022 Investing Haven

No Result
View All Result
  • Premium Services & Login
  • Premium Investing Service
  • Premium Trading Service
  • Premium Crypto Service
  • 2022 Forecasts
  • Markets & Stocks
  • Commodities & Gold
  • Crypto Markets
  • Mission 2026

Copyright © 2022 Investing Haven

Login to your account below

Forgotten Password?

Fill the forms bellow to register

All fields are required. Log In

Retrieve your password

Please enter your username or email address to reset your password.

Log In