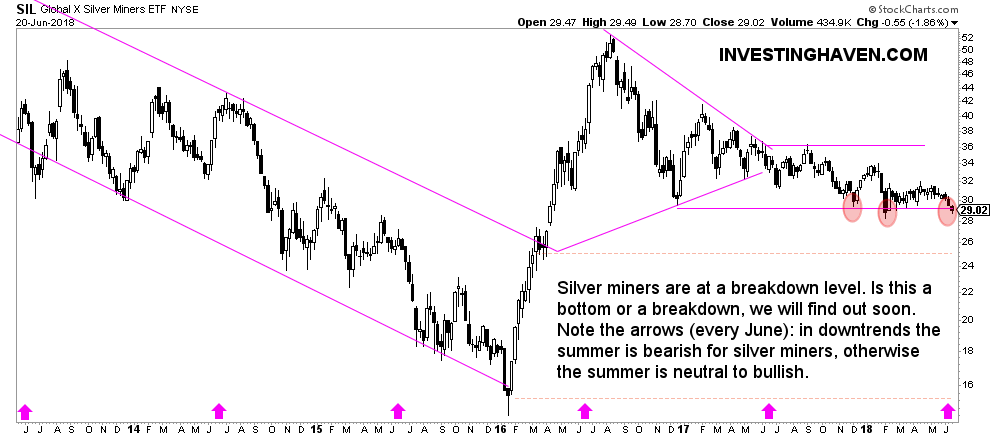
About a month ago we noticed that the Silver Miners Chart Signals “Time Is Not Ripe” Yet. Essentially we observed a flat pattern on the silver miners (SIL) chart. That was somehow in line with the long term silver price chart which is in a consolidation mode right at the end of a massive triangle chart setup.
We interpret that silver (SILVER) chart is preparing a big move as explained in 35 Year Silver Chart Indicates Big Move In Silver About to Start.
Looking at the latest evolution on the silver miners chart it is interesting to see how the flat pattern is being ‘tested’ right now. The SIL ETF representing the silver miners sector trades at 29 points now. So far, in the last 9 months, this level has been ‘tested’ twice, and it hs held strongly. This increases the importance of this particular price point. Smart investors are watching this level closely, very closely.
What is about to happen in the silver mining space? That is the million dollar question top of mind of investors.
We have a hard time forecasting with a high level of probability silver miners will hold strong (bottoming at this point) or not (breaking down). The reason is that there are conflicting forces at work. On the one hand the US Dollar is making a huge rounding bottom which may be bullish, and provide pushback to the precious metals space. On the other hand the long term silver price chart is about to resolve a massive triangle pattern which, likely, will have a bullish outcome.
That said, the gold price is likely bullish in the next few months so we tend to believe that silver miners are bottoming at this point. We will soon find out whether our expectation is accurate.


