The S&P 500 (SPY), the Dow Jones Industrial Index (DJI) and most indices closed in the red on Friday. Since February 1st, markets experienced a rather volatile period and it was no exception for both the S&P 500 (SPX) and the Dow Jones Industrial Average (DJIA). Our article today will look into why Both the S&P 500 and the Dow Jones Industrial Average are down and most important, what are the crucial support levels investors should watch for.
SPX and DJIA Down, what triggered the drop?
Stocks had a strong start in 2018, and just as investors were getting more and more complacent, a first market correction hit in a quick and unexpected way. In retrospect, complacency describes best the sentiment in the market towards the end of 2017 and the start of 2018. Back then, when we wrote about the potential correction in the stock market and warned specifically about the general complacency we noticed, it seemed like it was impossible for the rally in the American markets to stop let alone a correction to happen. 2 months ago, we also noticed how the Home Construction industry was correcting: Watch Out Below. Is The Home Construction Sector Eyeing This Support Level?
Yet the market correction happened, not in November as we initially forecasted but in February 2018. As markets started recovering, the market took, again, another abrupt turn. Financial news were quick to point out the rising yield as the main factor that spooked investors. Later on, they pointed towards the announcement of “Trump tariffs” on imported steel and aluminium. A few days ago, the fear in the market was driven by concerns over a potential trade war with China whom vowed to slap the equivalent tariff on US exports.
SPX and DJIA: The real story is in the charts
If our warning of a potential quick crash in SPX in 2018 went unnoticed, for the past two weeks, we have been receiving countless emails and requests to assess the impact of the recent markets movements in the stock market and indices as a whole. This article today seeks to educate investors on important price levels to watch for if indices continue to head south.
In fact, during this extended period of high volatility where indices have been fluctuating with more than 500 points due to phony financial news and unnecessary panics, our InvestingHaven research Team firmly believes that the most valuable information can be retrieved from charts rather than news.
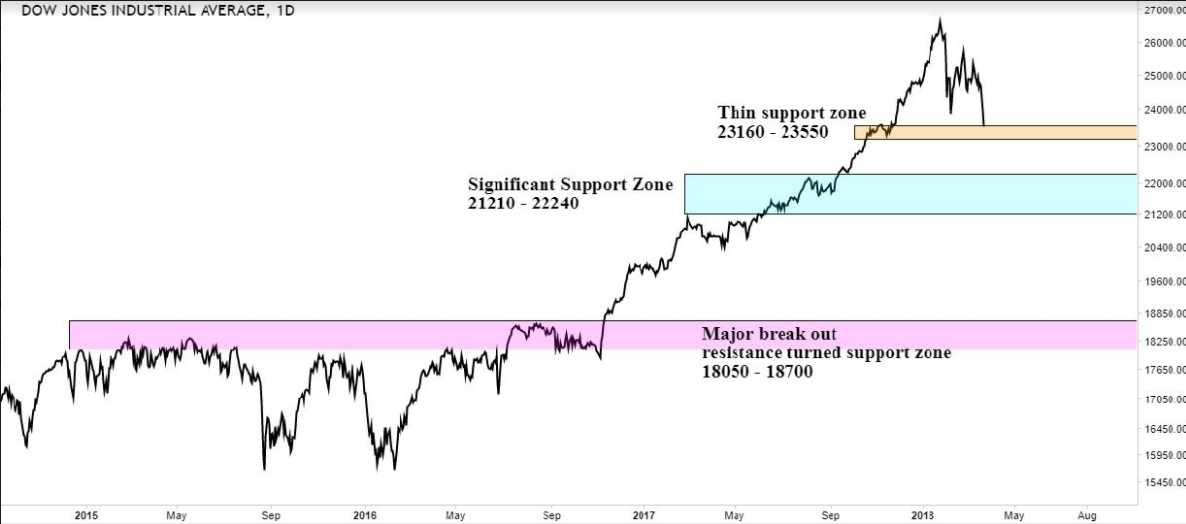
The daily Dow Jones Industrial Average (DJIA) line chart shows that the DJIA index is going towards the thin support zone of 23160 – 23550 for sure within the next 2 weeks. We feel that this thin zone has a large chance of being pierced through a’though the latest news has top officials from USA and China agreeing to communicate on trade issue.
Our research team is more concerned with the significant support zone of 21210 – 22240 (±). Should the blue zone break lower, the penultimate zone lies in the 18050 – 18700 as this is also the former resistance turned support. It is also a major pre-Trump support zone. Still, no matter how much we emphasize the strength of this support zone, the price could decide otherwise without heading towards the zone we identified.
Similarly, the same behavior can be observed in the SPX. The thin zone of 2560 – 2590 looks vulnerable for the next 2 weeks. 2380 – 2480 will be the critical support zone and this support is breached, the next most important support zone will be 2130 – 2185.
Through volatility, the most important action is to remain calm to be able to make sound decisions. This will be particularly hard for those who bought at the Top. Please do discuss with your financial adviser and brokers for more money management and risk mitigation during time of high volatility.


