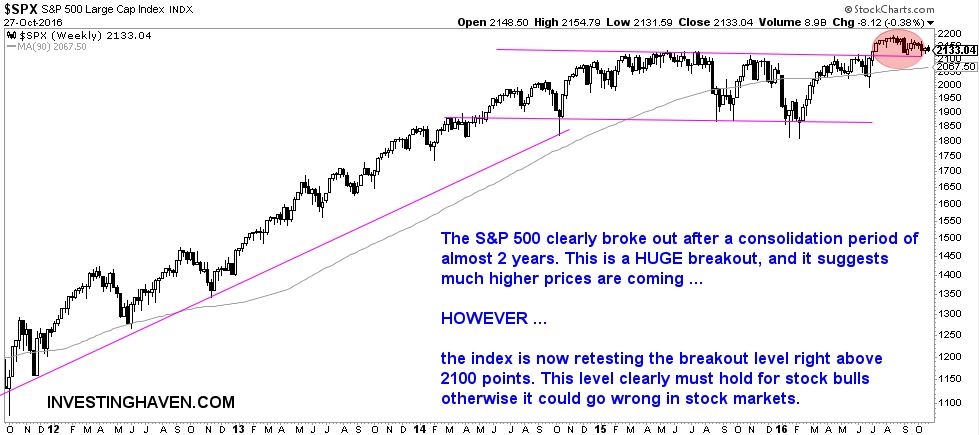
Stock markets in the U.S. and Europe are basically going nowhere, since the last two months.
Sentimentrader had some great observations in the last couple of days:
U.S. equity funds got punched again. There was a huge outflow from domestic funds that focus on stocks, the 5th-largest since 2007. Total fund assets have grown over that time, but even if we express the outflow as a % of total assets, it was large. There is a temptation to automatically consider such an outflow to be a contrary indicator (and bullish for stocks) but the history of other large weekly outflows has been mixed.
Moreover, from a price perspective, Sentimentrader believes the stock market has arrived at a make-or-break level, which, by the way, is a similar conclusion that we have drawn from a chart perspective when analyzing our own charts:
If stocks are going to rally, then now should be the time. From the last 3 days of October through the first 3 of November, SPY has rallied 19 out of 23 years. It has averaged a gain of 1.6%, with a risk/reward ratio that was skewed more than 2-to-1 to the upside.
Apparently, there is a consistent pattern of weakness right before U.S. elections. As Sentimentrader observes, weakness consistently appears in the period before the elections:
The election is almost here. Looking at other U.S. presidential elections since 1950, stocks have often seen some weakness prior to the election itself and diverged widely after the results were in. Among the major sectors, tech and financials usually saw the best gains after the elections but, again, there was wide variability.
Given all the above insights, and given the chart pattern seen below, we would say that stocks are currently trading at a critical level: it is make-or-break time, and Tuesday November 8th will probably mark the start of a new period in stock markets.


