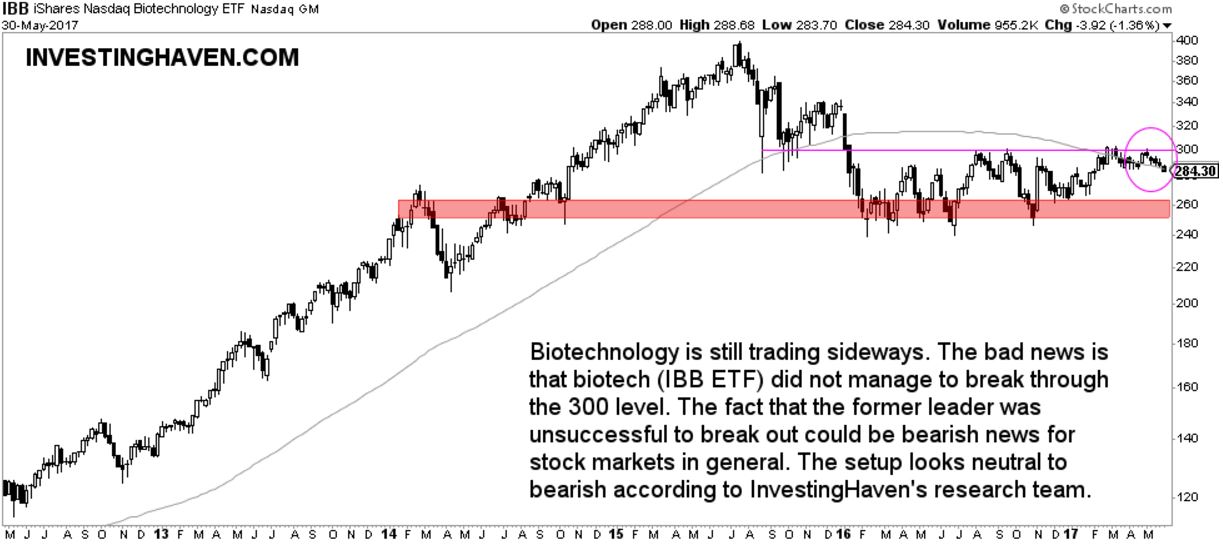
The biotechnology stock market sector is starting to behave as a laggard. There is no breakdown on biotechnology’s chart (yet) but we observe the first signs of a lagging behavior.
It has been a rollercoaster ride in the biotech space in the last 18 months. InvestingHaven’s research team has extensively written about the ups and downs the sector has gone through:
- In February this year: Biotechnology Stocks Breaking Out After 20-Month Consolidation Period
- In December last year: Biotechnology Stocks Refusing To Break Down
- In December last year: Biotechnology Stocks Have News For Investors: It is Now or Never
- In May last year: Biotechnology In A Spectacular Position
The biotech chart reflects the ups and downs. Embedded is the IBB ETF chart, representing the biotechnology stock market sector. As seen on the chart, the sector is in a consolidation mode since last January. IBB has been moving between 240 and 300 points.
However, IBB has not been able to break above 300 points lately. After 4 attempts to break out, it seems that the biotech space is moving lower now. That is not good.
The fact that biotech was not able to break through 300 points is not only bearish for its own sector, it could have bearish implications for the stock market as a whole. That is because biotech used to be a leader until 18 months ago. A former leader which is not able to break through an 18-month consolidation period is not good for broad stock markets.
We would not be surprised if the biotechnology space would send a neutral to bearish signal for broad stock markets.


