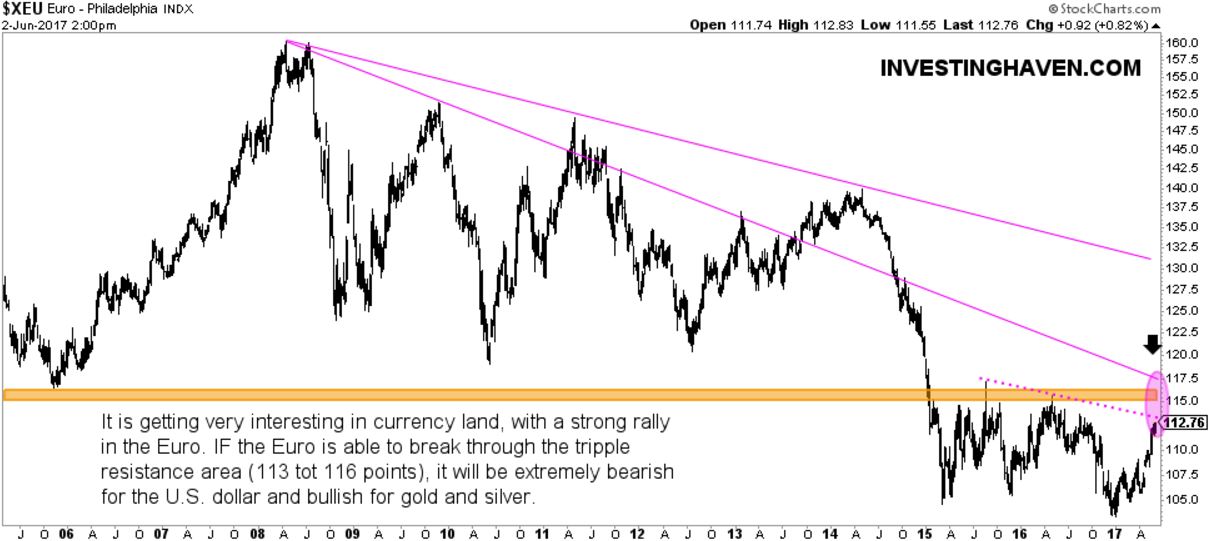
Investors are very closely watching the Euro. Its chart has incredibly interesting setup, and could spell a major move in gold and the U.S. dollar.
The Euro has risen from major support at 104 points to 112 points today. We noted at the end of last year that Euro’s long term chart looked scary. If the 104 level would not hold we would have witnessed a major breakdown in the Euro. That did not happen though.
Instead, the Euro rose rather sharply, some 8 percent this year. The key question is: what happens next.
InvestingHaven’s research team does not pretend to have a crystal ball. However, one thing is crystal clear: the Euro is bumping into tripple resistance now: the 113 to 116 area (see purple circle) is a juncture area of both long term and middle long term resistance.
If, and that is a big IF, the Euro would be able to break through this area, it would have major implications for the U.S. dollar and for gold: it would be extremely bullish for gold and very bearish for the dollar.
It is no coincidence that the Gold price is attempting to breakout and set a bullish trend for 2017, as we speak. There is a correlation between the setup of gold and the one on the Euro chart.
Smart investors are watching closely both the Euro and gold chart to get a sense of the next big moves in currency land and in gold for the remainder of 2017.


