The gold (GOLD) futures market is writing history in 2018, again. Particularly, the gold futures market shows extremes in positions of key market participants. Compared to the other similar extremes in the gold futures market in the last 10 years it suggests to us that the gold price is setting its major bottom of 2018. This is in line with gold charts with long term timeframes.
Astute readers remember how we published our Gold Price Forecast For 2018 almost a year ago when the price of gold was testing its support $1200 to $1220 level. We were bearish at that point in time. However, right after our publication the futures market, one of our leading indicators, changed its shape. We updated readers about this event, and early this year the gold futures market confirmed its new trend which was also reflected in the price of gold.
Gold market seasonality at play, also in 2018
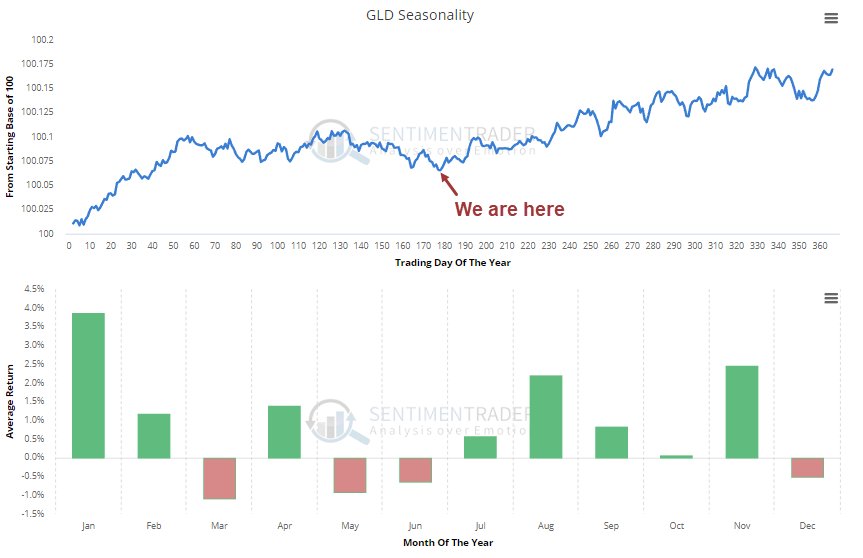
One important insight to take into account, in all this, is Gold Price Seasonality. In our recent article we warned that, no matter whether we see a bullish long term outlook for gold, in the short term the typical ‘summer doldrums’ effect will kick in. This is what we wrote:
The gold futures market shows that commercial traders are close to an extremely low position. That would translate into a bottom rather than a top in the gold price. Does this mean the gold price cannot go lower? Not at all, the gold price can take a dive towards the $1150 area even in the next few weeks. But we do not see it going much lower than there.
We continued with this conclusion:
Now what seems to be happening right now is a mega cup-and-handle formation on gold’s chart as explained recently. That is a bullish pattern. It is one in which a short term bearish move comes after a breakout attempt just to shrug off all the bears that are still in the market, and continue only with bulls.
The gold price seasonality chart is embedded below, courtesy of Sentimentrader.
Gold futures market at extremes in 2018, again
We turn our attention to the gold futures market especially its high level structure in 2018.
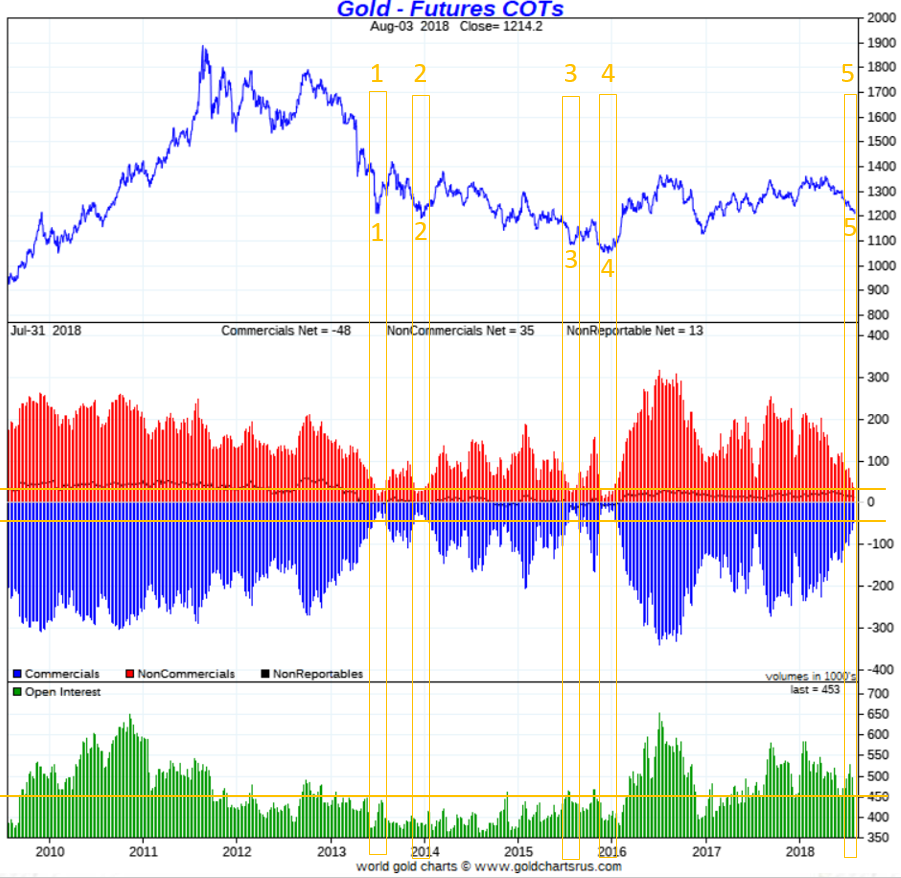
As seen on the chart below the net positions of commercial and non-commercial traders is at extremes. Commercials are at a record low number of net short positions. Non-commercials are at a record low level of net long positions.
We have drawn this yellow horizontal line to indicate the level of both. Going back almost 10 years in time it is clear that a similar situation has occurred only 4 times.
That’s why we consider that the gold futures market is writing history in July 2018.
However, below chart annotations make it easy to compare the 4 other similar instances with today’s situation. And we note a very important difference with previous instances. The total open positions is (much) higher today.
This suggests that there is sufficient interest in gold today, even if net positions of key market participants are historically low.
Gold price bottom of 2018 being set?
For all reasons outlined above we believe that gold is setting a major bottom in 2018, as we speak. Although its price can fall slightly lower, somehow below the important $1200 level, we do not see this happening for more than 3 consecutive weeks.
We still believe that the gold market, lead by the gold futures market structure in 2018, is on track to set a major cup-and-handle formation. If accurate, this will be proven to be very bullish for 2019. That is why we will publish our gold price forecast for 2019 anytime soon.
Chart courtesy: Goldchartsrus.com


