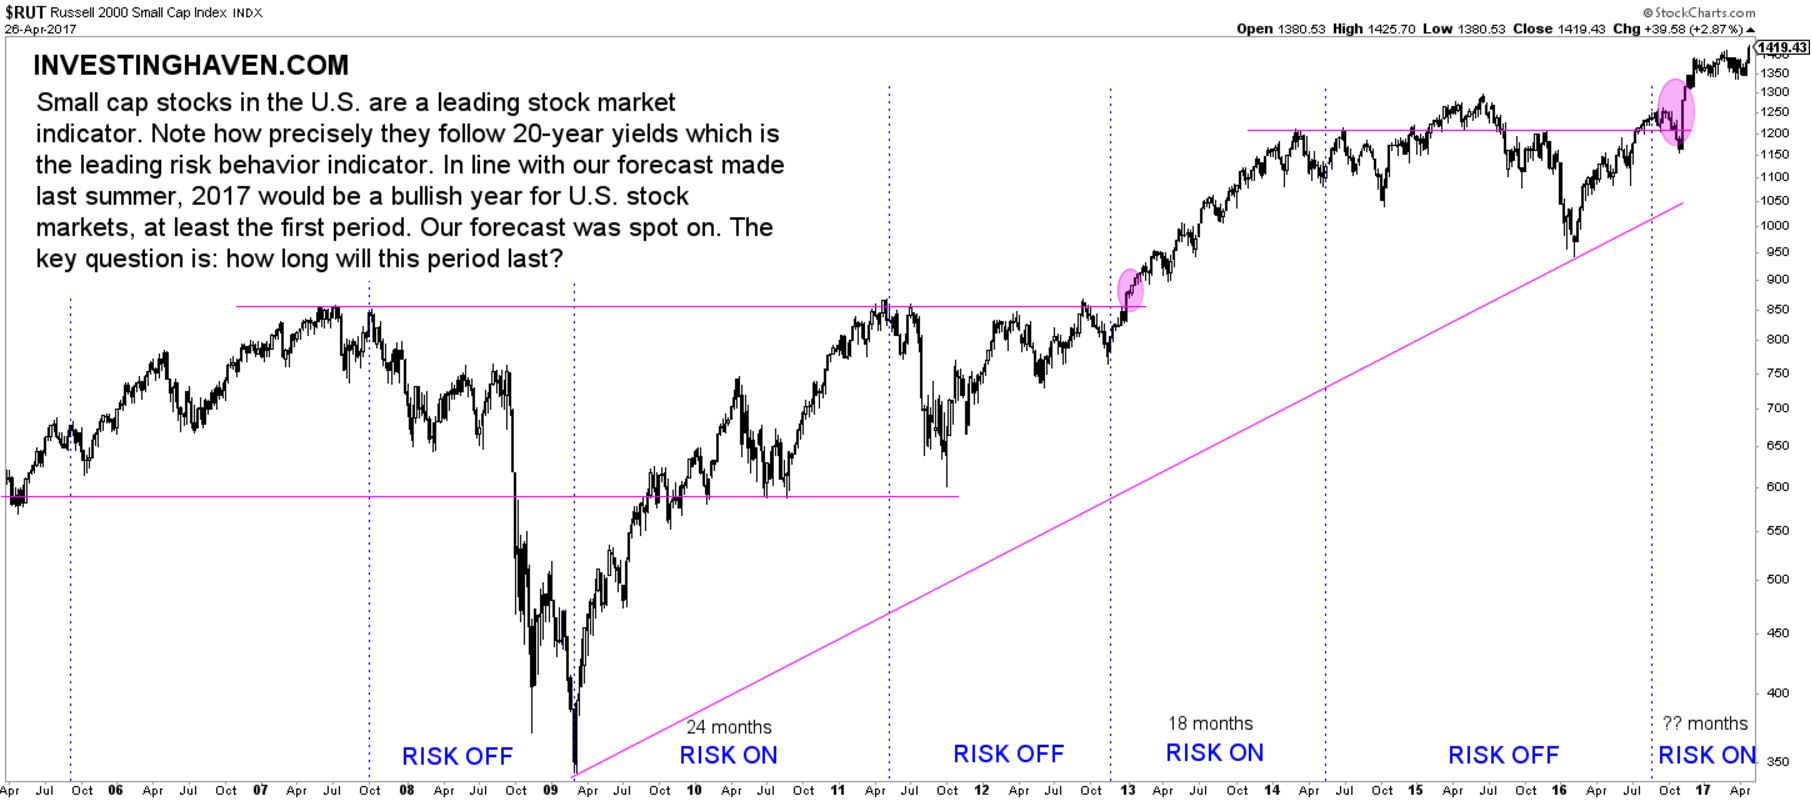
U.S. stock markets are hitting new highs this week. The Nasdaq Composite index broke through the psychologically important level of 6,000 points while the small cap index Russell 2000 (RUT) broke above 1400 points. The Dow Jones Industrials (DJI) index briefly touched 21,000 points, and the S&P 500 (SPY) was inches away yesterday from 2,400 points.
It seems that the stock market index is committed to continue its march higher.
InvestingHaven forecasted last summer that the U.S. stock market would go higher in the first half of 2017, based on this leading stock market indicator for 2017 which is the Russell 2000 in combination with 20-year Yields. That forecast appeared to be spot-on. This recent article followed up, and confirmed the same point: watch Yields as a leading indicator for stock markets in 2017.
The key point is that both stocks and Yields go through a recurring 12 to 24 month cycle in which investors alternate between risk-on (stocks up, Yields up) and risk off (stocks down, Yields down).
With this week’s all-time highs in stocks, the question is for how long this uptrend in stocks will continue. InvestingHaven’s research team forecasts that stocks will still do good until this summer. That is based on the team’s observation of a decreasing time span of the risk-on cycles:
- Between April 2009 and April 2011, the risk-on cycle lasted 24 months.
- Between November 2012 and May 2014, the risk-on cycle lasted 18 months.
There is a high probability that the current risk-on cycle will last some 12 months.
InvestingHaven reiterates that stock market will not crash in 2017. However, the start of a severe correction will certainly take place in the coming months, presumably the summer into fall.
Some of the very interesting stock market sectors for the coming weeks (short term trades): 3D printing stocks and clean energy stocks.


