It has been very quiet in recent months in markets. Almost every market has been moving without major volatility. That could be ending soon, though, with new major market trends triggered by the two leading currencies: the Euro and the U.S. Dollar.
This thesis and, in general, our market vision, is based on what we tend to call intermarket dynamics. That is the phenomenon of a market starting a strong trend, and, with that, triggering trends in other markets.
Great examples of intermarket dynamics include the huge breakout in the U.S. dollar in 2014 which triggered an enormou drop in the price of crude oil and, consequently, made global stock markets very volatile and weak. Another case is the early 2016 fear trade (stocks falling sharply) which resulted in a strong bid in gold, with precious metals miners shooting higher sharply.
Typically, new trends start once leading markets break through major resistance or support levels. That is why smart investors continuously follow how markets evolve. Investing is not about hoping or anticipating that a trend starts; it is about analyzing all markets, and identifying new trends as they arise. That requires continuous analysis and scenario analysis.
The two charts, right now, that are hitting major support and major resistance: the Euro and the U.S. dollar.
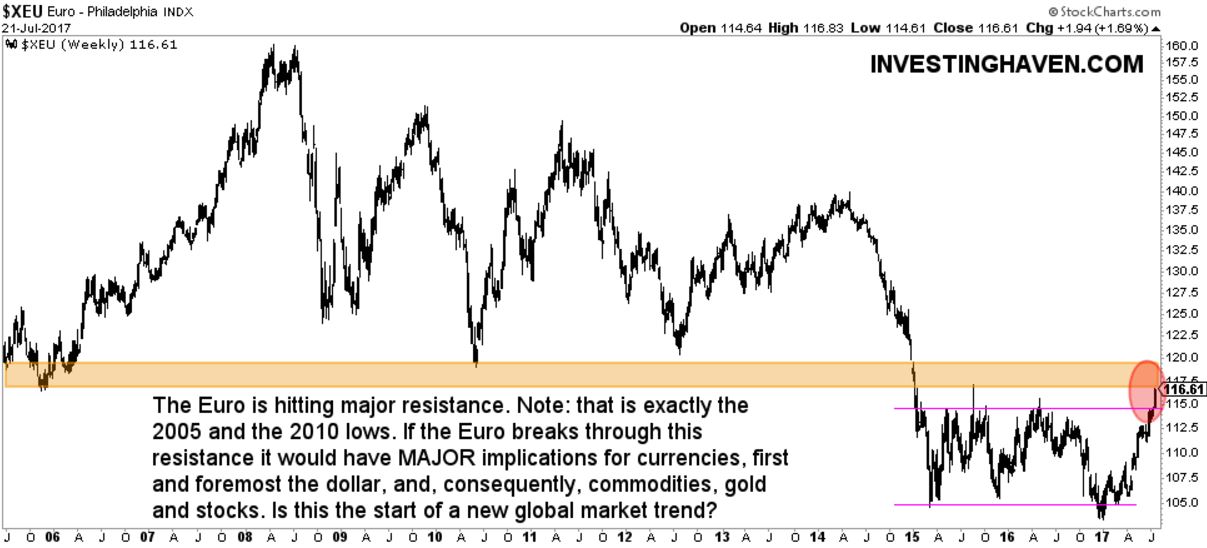
First, the Euro is testing its 2005 lows, as well as its 2010 lows. Note how a trading range between 105 and 115 points has formed on the Euro chart in the last 30 months (since early 2015). Right now, the Euro is trading at 116.6 points, the highest level since December 2014.
As a sidenote, this is an interesting case of how financial mainstream media tend to publish a lot of information but mostly irrelevant to investors. CNBC, for instance, wrote this week how the Euro could go to 120 points, which is interesting to know but does not add any value at all for investors. As the chart below suggests the 120 level is still resistance, so as long as the Euro does not trade significantly above 120 there is no change in trend whatsoever.
The long term resistance are is indicated with the yellow bar on the chart. As seen, this is a major resistance level. If the Euro is successful in breaking above this resistance it would have major implications for all markets worldwide, and it would trigger new trends: it would be wildly bullish for gold and silver, bearish for the dollar, and very bullish for European Treasuries. What it would mean for stocks and commodities, both risk assets, is not clear at this point, as a strong rise in Treasuries could suggest a “risk off” sentiment.
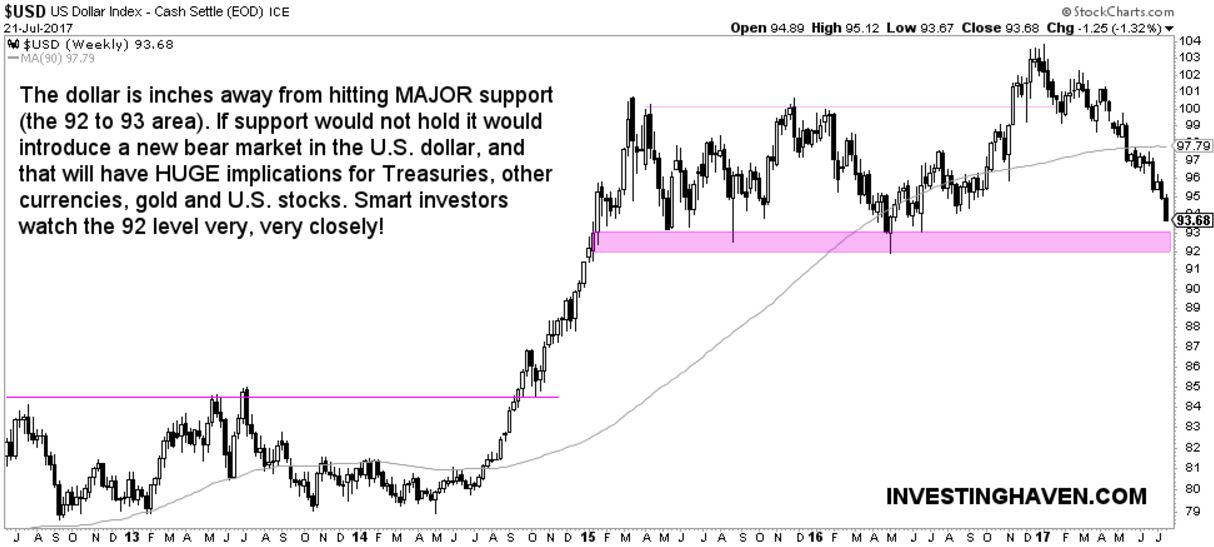
As the Euro / Dollar is the most important currency pair, it should not come as a surprise that the dollar is inches away from hitting major support (the opposite of the Euro). As seen on below chart the Dollar has a very strong support area at 92 to 93 points, just one percent below today’s price level.
We could expect the dollar to respect its support given the very long term US Dollar chart. However, nothing is a fact in markets until it happens, so we remain open for every new trend.


