Silver prices continued their downtrend this week. Silver peaked at $18.00 this week, and lost 4 percent as they closed at $17.22. The silver price chart looks not very constructive at this point. InvestingHaven made the point that the price of silver could have peaked for the year, a not so bullish silver price prediction for the year. However, every price decline always ends with a buying opportunity, so investors with a lot of patience will be rewarded late this year or next year.
“With just two trading days left in April, silver looks as if it peaked for the month at $18.514 an ounce on April 17.”
That market forecast appeared on MarketWatch. Myra Saefong from the editorial team commodities and investing at MarketWatch featured InvestingHaven’s silver price prediction based on an exclusive seasonality chart.
We explained to MarketWatch that calendar years are important to gold and silver, which is because investment and jewelry demand both from the East and the West has always been the highest between December and April. That’s what has created a “seasonal pattern” in gold and silver prices.
Moreover, as the chart below shows, silver tends to peak in April — the only exceptions being the raging bull market years 2009 and 2010.
A silver price prediction is complex because of silver’s dual role: it is both a precious metal and a base metal which means it can react in an ‘unpredictable way’.
“In silver’s case, the dominant force was base metals in the last couple of months. Prices for those metals were ‘lagging,’ and then with U.S. President Donald Trump’s presidential victory, base metals played catch up.”
Note that our silver price prediction will be invalidated if a real panic would ensue as a result of politics. But given the current state of politics, we see ‘more of the same’ and investors have accepted the idea of this ‘new wave of politics’ with the election of Trump and the U.K. vote to exit the European Union.
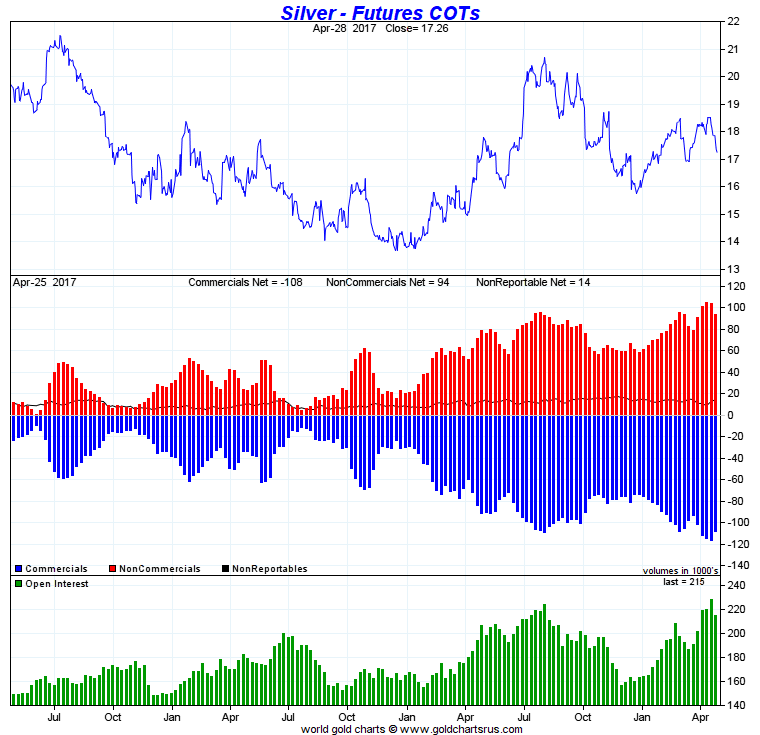
Another data point, important in our methodology, though not mentioned on MarketWatch, is the futures market positions. The blue bars on below chart show the short positions of commercial traders (hedging positions). They are at the highest level, not only in the last 3 years (as seen on the chart) but also on a multi-decade basis (not visible on this chart). That is definitely not a recipe for higher prices, on the contrary.
Futures positions are not a good timing indicator, they are also not necessarily a leading indicator. However, as a secondary indicator they tend to provide confirmation of a bullish or bearish case once they are at extreme positions, which is the case right now.

![[:en]silver price forecast[:nl]zilverprijs voorspellling[:]](https://investinghaven.com/wp-content/uploads/2017/04/silver_price_forecast_marketwatch.jpg)


