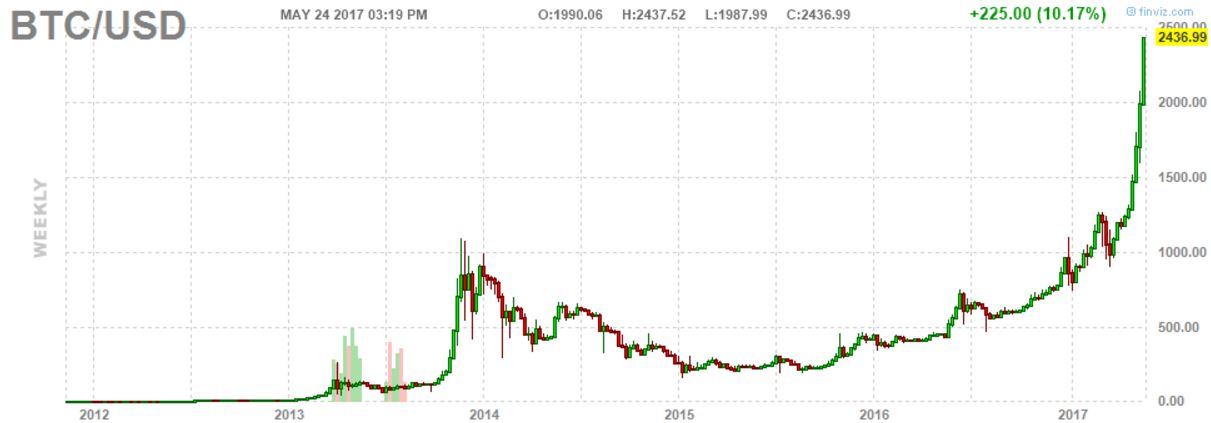
It is happening in front of our eyes, right here right now. The most amazing chart in history of markets is developing. It is not gold, is not China’s stock market, nor is it the crash of the Pound Sterling.
It is the chart of virtual money, Bitcoin. Nobody is able to touch it, but it can transact with the blink of an eye. No waiting times, no cross border payments with any risk or frustration of waiting 3 days. All that does not exist in the world of cryptocurrencies.
Bitcoin has an amazing chart. Probably we have not seen this before in history of markets, even not in the dotcom bubble.
What is the most amazing thing in cryptocurrencies? Nobody has any idea where the limit is of its value. All other markets work differently. They have a point where it becomes overvalued. What is overvaluation in Bitcoin? Read all about it in our bitcoin price forecast and our Ethereum price forecast.
The point with Bitcoin, as well as with other cryptocurrencies, is that they are driven by supply/demand, and that supply is finite.
Moreover, we are nowhere near a point of critical mass in terms of adoption (demand side of things).
With those two things in mind, we believe the answer to the question what overvaluation means for Bitcoin could provide a dizzying answer.
We are not going to guess or overpromise, but given the facts outlined in our latest article 10 Investment Tips For Cryptocurrencies Investing, and especially the Bitcoin adoption statistics, we see a real boom coming in cryptocurrencies in the near future.
If you believe that the chart below is amazing, then it could become the most amazing chart ever in history of markets. It could happen in 2017 or 2018.


