Donald Trump’s election win took the stock market by surprise, and sent it to new highs. This was a totally unexpected turn considering the concerns preceding his election.
Back then, especially before the election, the respected Nassim Taleb, author of Black Swan, didn’t see his win, that is if it was to happen, as scary as the media was making it sound and he was right in his prediction.
Almost 1 year after the election, here is an up-to date review of the Trump effect on the markets, what the outlook looks like and how long the Trump effect can possibly last. In other words, will the Trump effect last in 2018?
Trump Effect based on the Dow Jones Industrial
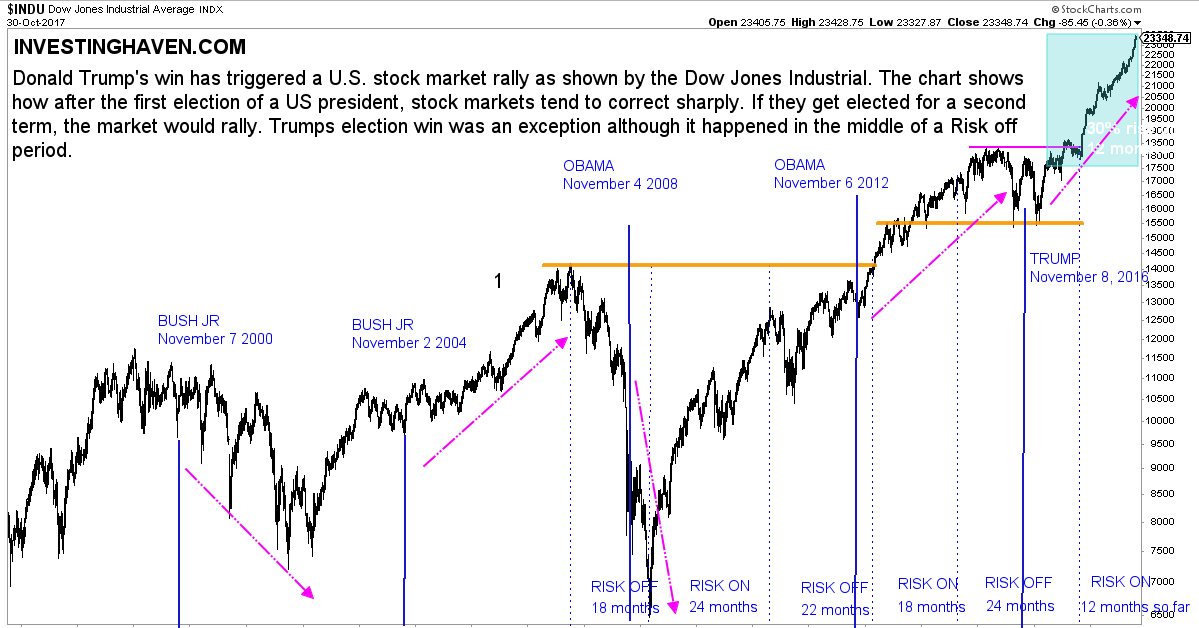
The following chart shows how following a presidential election win for the first time, the market corrected rather sharply. The opposite happened following the presidential election win for a second term as shown by the ralliess from 2004 and 2012. November 2016 broke that pattern, as it triggered a rally in US equities.
Someone else was probably foreseeing the same pattern: Georges Soros. He reportedly lost 1 Billion Dollar after the elections betting on the US market to fall sharply.
We also observe how the Trump effect took “effect” towards the middle of a risk off period where money would usually flow into safe havens.
Trump effect on consumer sentiment
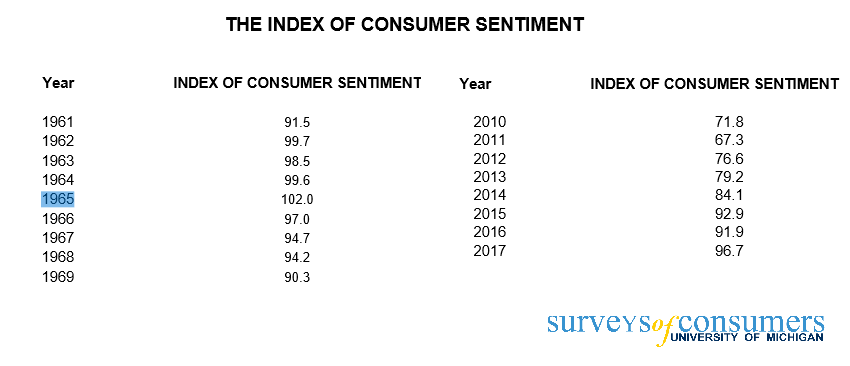
US Consumer sentiment is at its highest. October numbers show how we are at historically high figures:
In fact, there are 2 periods in American history where we saw a similar level of positive sentiment in the market: From 1999 to 2000 era and from 1965 to 1969 era.
That is not to say that we are in a dotcom bubble. In fact, at Investinghaven we repeatedly said that we don’t foresee a Market Crash in 2017 But a correction is very likely.
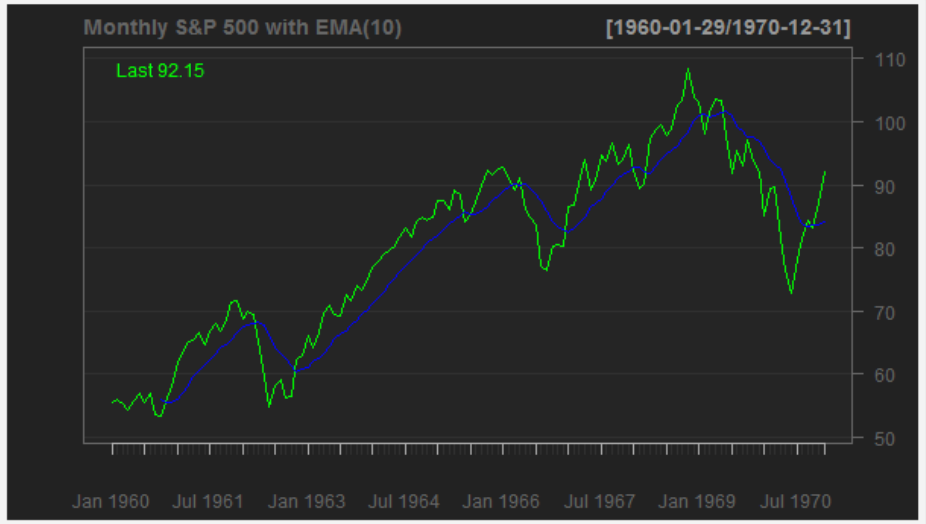
That’s why we find interesting that there are so many similarities between what we are seeing in the market nowadays and what happened in the 60’s.
The 60’s were known for a strong sentiment of Distrust in the US government. Yet the stock market continued on an uptrend for most of the decade because of renewed trust in the American Economy. A similar sentiment is observed in the US stock market in 2017. According to the University of Michigan’s Surveys of Consumers chief economist, Richard Curtin:
Consumer sentiment slipped ever so slightly in late October, despite remaining at its highest monthly level since the start of 2004. This is only the second time the Sentiment Index has been above 100.0 since the end of the record 1990’s expansion, and its average during the first ten months of 2017 (96.7) has been the highest since 2000 (108.5). The October gain was reflected in more favorable consumers’ assessments of current economic conditions (+4.8) as well as expected economic prospects (+6.1)… More than half of all respondents expected good times during the year ahead (2018) and anticipated the expansion to continue uninterrupted over the next five years.
Trump Effect on markets in 2018?
The bullish Scenario The S&P 500 continues on its upwards movement after a sharp and quick correction. This would be similar to the S&P performance between 1960 and 1968. Investors will need to observe the progress and outcome of the tax reform as it could trigger a move in either direction. We favor this scenario.
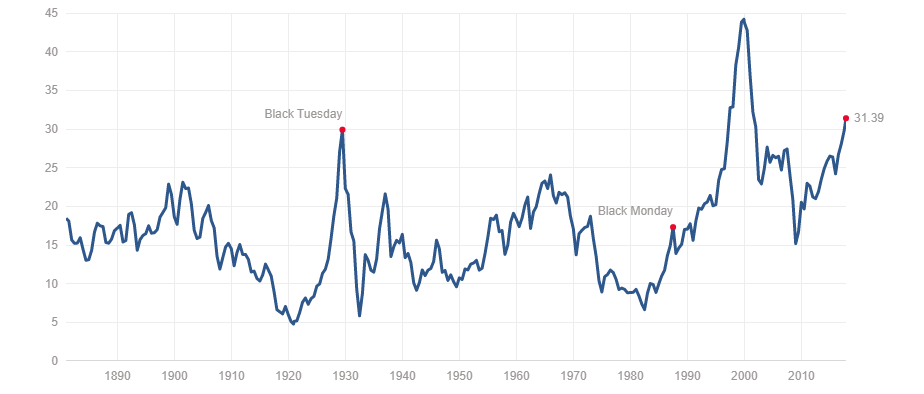
The Bearish scenario is that the market is at the Top currently and we see a stock market crash in 2018. We do not see this happening anytime soon but the Siller PE ratio is rather concerning and at a minimum suggests that the market is due for a correction.
To conclude, we foresee a Trump effect as we know it possibly lasting during 2018 with a sharp correction towards year end 2017 early 2018 before the uptrend continues. As said in the past, for the best indication of how long the Trump effect will last:
Follow the industrials stock market sector in relation to the stock market index. In terms of stock market symbols: follow the XLI to the SPX chart.
