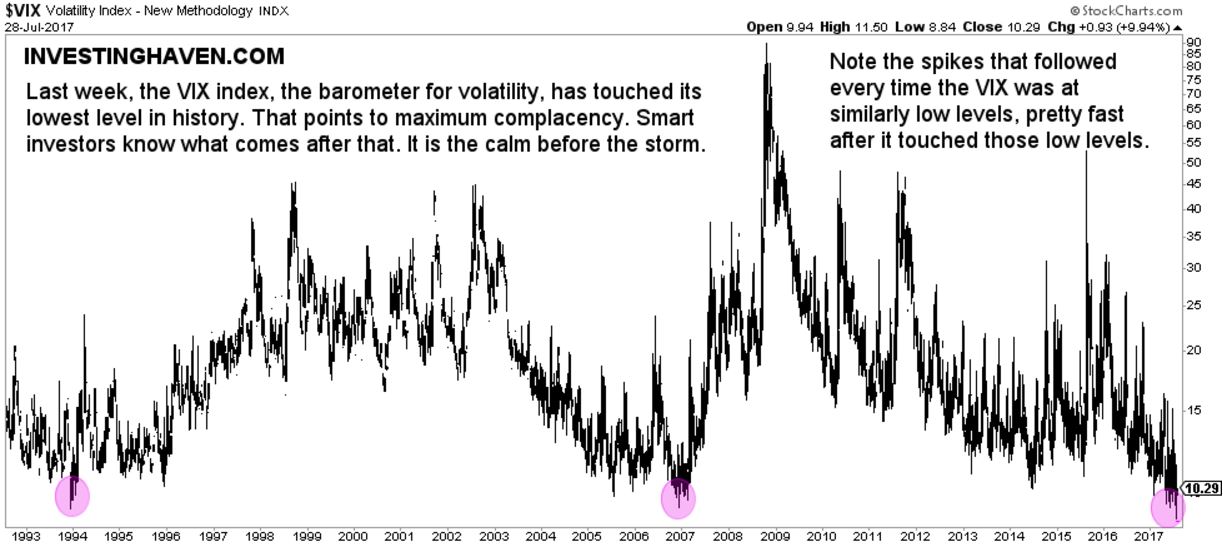
The volatility index (symbol VIX) is a measure for volatility on the U.S. stock exchanges. The VIX wrote history this week: it hit its lowest level EVER, at 8.84 points. That has never happened before in the almost 30 years this instrument exists.
This is bearish news, says InvestingHavens‘ research team.
As always, the news items that hit the wires just go with the trend, and are certainly not useful as input for smart investors. CNBC writes that traders are “reducing their bets that volatility will jump significantly higher from here, according to TD Ameritrade’s JJ Kinahan.” It becomes even worse: this analyst on SeekingAlpha published an article in which he questions whether volatility is dead.
Those are signs that people got used to a very low volatility environment. Be that as it may, we start getting concerned because ultra low volatility does not last forever.
The historic VIX index chart makes our point. The only instances where the index was that low, around 10 points, in the last 30 years, were followed by quick spikes up … maybe not immediately, but relatively soon after the 10 point mark was hit. Note the 3 purple circles on the chart.
Does that suggest that markets will crash? That is certainly NOT what we are suggesting. We are saying that historically low volatility will not last long. As volatility picks up, it bears watching which markets and segments do well and which ones sell off. For instance, it could well be that gold will act as a fear trade in the coming months (if that is the case, it will be reverse its long term bear trend into a bull trend) and that bonds will outpeform …
So the message of this chart is that maximum complacency is not bullish, but it triggers smart investors to watch closely what is going to happen as volatility will pick up in the coming weeks and months.


