Investing Haven
No Result
View All Result
Gold Silver Investing >>
CRYPTO INVESTING >>
  • 2025 Forecasts
    • 10 market predictions
    • Dow Jones forecast
    • S&P 500 forecast 2025
    • Nasdaq prediction 2025
    • Best altcoins to buy
    • Best crypto to buy now
    • Which crypto will explode
    • 15 crypto forecasts 2025
    • Which precious metal to buy
  • Silver
    • Silver prediction 2025 – 2030
    • Will silver exceed $30?
    • When will silver hit $50?
    • Can silver hit $100?
    • Silver shortage
    • 50-year silver chart
    • Silver bullish reversal
    • Silver seasonality charts
    • How to invest in silver
  • Gold
    • Gold prediction 2025 – 2030
    • Will gold set new ATH?
    • Will gold hit $3,000?
    • Can gold hit $10,000?
    • Gold chart 10 years
    • Gold chart 50 years
    • Gold chart 100 years
    • Gold silver ratio
    • Gold seasonality charts
  • Commodities
    • Coffee forecasts
    • Sugar forecasts
    • Nickel forecasts
    • Lithium investing
  • Crypto forecasts
    • BTC prediction 2025 – 2030
    • ETH prediction 2025 – 2030
    • SOL prediction 2025 – 2030
    • XRP prediction 2025 – 2030
    • XLM prediction 2025 – 2030
    • BNB prediction 2025 – 2030
    • ADA prediction 2025 – 2030
    • AVAX prediction 2025 – 2030
    • KAS prediction 2025 – 2030
    • NEAR prediction 2025 – 2030
    • BCH prediction 2025 – 2030
    • LINK prediction 2025 – 2030
    • DOT prediction 2025 – 2030
    • SUI prediction 2025 – 2030
    • ICP prediction 2025 – 2030
    • LTC prediction 2025 – 2026
    • STX prediction 2025 – 2030
    • DOGE prediction 2025 – 2030
    • SHIB prediction 2025 – 2030
    • PEPE prediction 2025 – 2030
    • FLOKI prediction 2025 – 2030
    • WIF prediction 2025 – 2030
    • ONDO prediction 2025 – 2030
  • News
    • Crypto news
    • Commodities
  • Login
Investing Haven
No Result
View All Result

Home » Trendwatching » The 3 Must-See Silver Charts Of 2018

The 3 Must-See Silver Charts Of 2018

Taki Tsaklanos by Taki Tsaklanos
November 28, 2023
in Trendwatching
silver chart 2018
2.5k
VIEWS
Share on FacebookShare on Twitter

In our Silver Price Forecast 2018 which we wrote last October we explained why we did a neutral trend forecast for the price of silver (SILVER) in 2018, with a bearish bias. We also said that we had a hard time forecasting the 2018 silver price because of the hard-to-read setup, and we promised readers to continuously follow up until we start seeing clear signals in the silver market which could lead to a price target.

This is what we wrote last October:

Let’s get things straight:

  • As long as silver does not rise above $21 it has not broken out in which case it is trendless or bearish.
  • If silver falls below $16 (and stays below 16 for at least 3 consecutive weeks) it is bearish.
  • Between $16 and $21 silver is neutral.
  • Moreover, $14 is a major price level as it marks the lows of the last 9 years. If silver sets a major double bottom between 14 and 15 in 2018 then (only then) will we become very bullish for the long term.

However, we are very closely watching what happens near the $14 price level for reasons outlined above. That is to get an idea on the secular support levels. Similarly, once silver starts rising in the first months of 2018 (seasonal strength) we are closely watching the $21 area as secular resistance.

Now, fast forward to March 2018, we start seeing a couple of signals which might be encouraging for silver bulls.

Let’s revise our thesis based on these 3 must-see silver charts for 2018.

Note: we are not going to analyze news items, fundamental trends, supply/demand, as that’s noise for the future price of silver in 2018 or any year beyond: the silver to gold ratio may be high or low, gold or silver may be compared with a zombie, there may or may not be correlations with economics data … we simply do not care. Why? Because we remain firm in our method and vision which is (1) Tsaklanos his 1/99 Investing Principles suggest that only 1% of news has 99% of value and (2) the vast majority of news is just that, news, in the traditional sense of the word, without any value for investors.

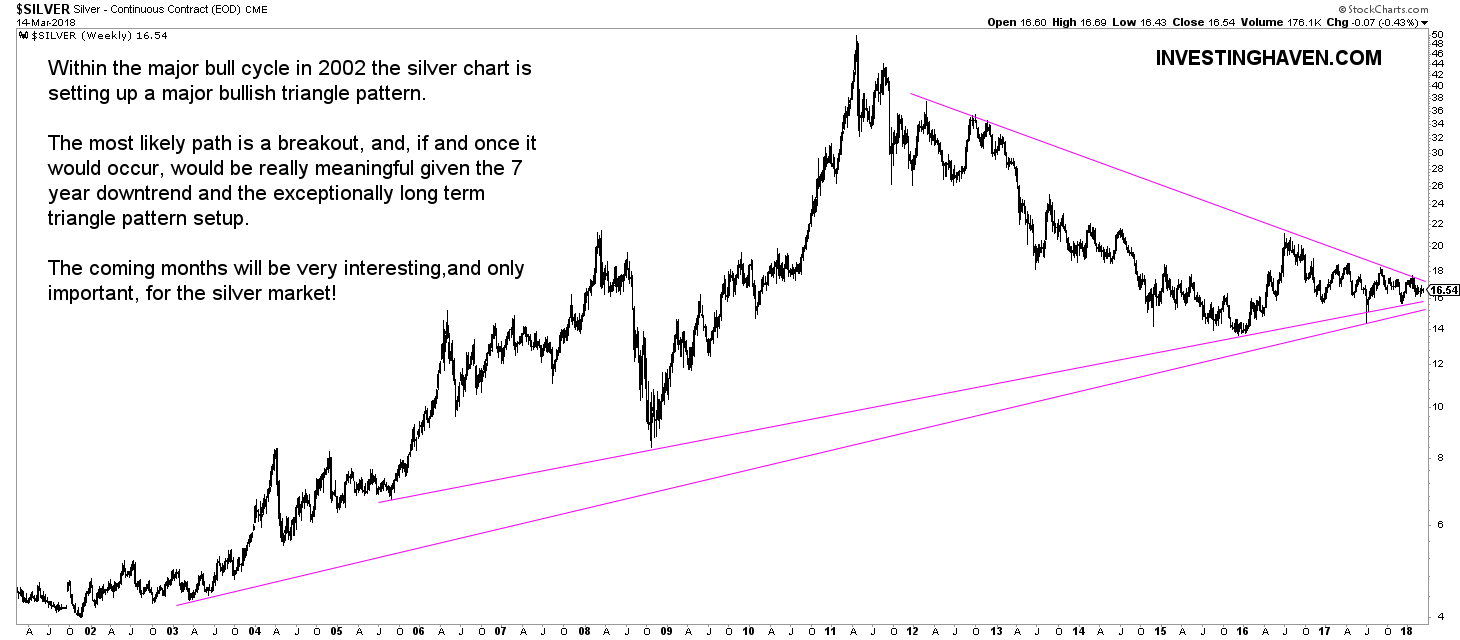
The weekly silver chart in 2018: a pressure cooker

We remain firm in our view that the chart is the compass for investors. What matters is having the ‘right chart’: create the right timeframes, set the right indicators, identify the right patterns.

The silver chart over the last 17 years (the major cycle starting with the strong bull market and followed by the crash and 7-year bear market) is a pressure cooker. The pattern suggests that a major move is brewing.

Last year, we were slightly bearish because, as said, we saw support being broken. That did not materialize, and we are open minded to admit that it changes our view. We are no perma bears, nor perma bulls, we are here to be successfull, and, with that, share successes with readers.

The current chart setup, primarily the series of higher lows over the last 24 months, combined with the visible long period of prices moving against the resistance trend line, suggest that a breakout is more likely than a breakdown.

silver chart 2018

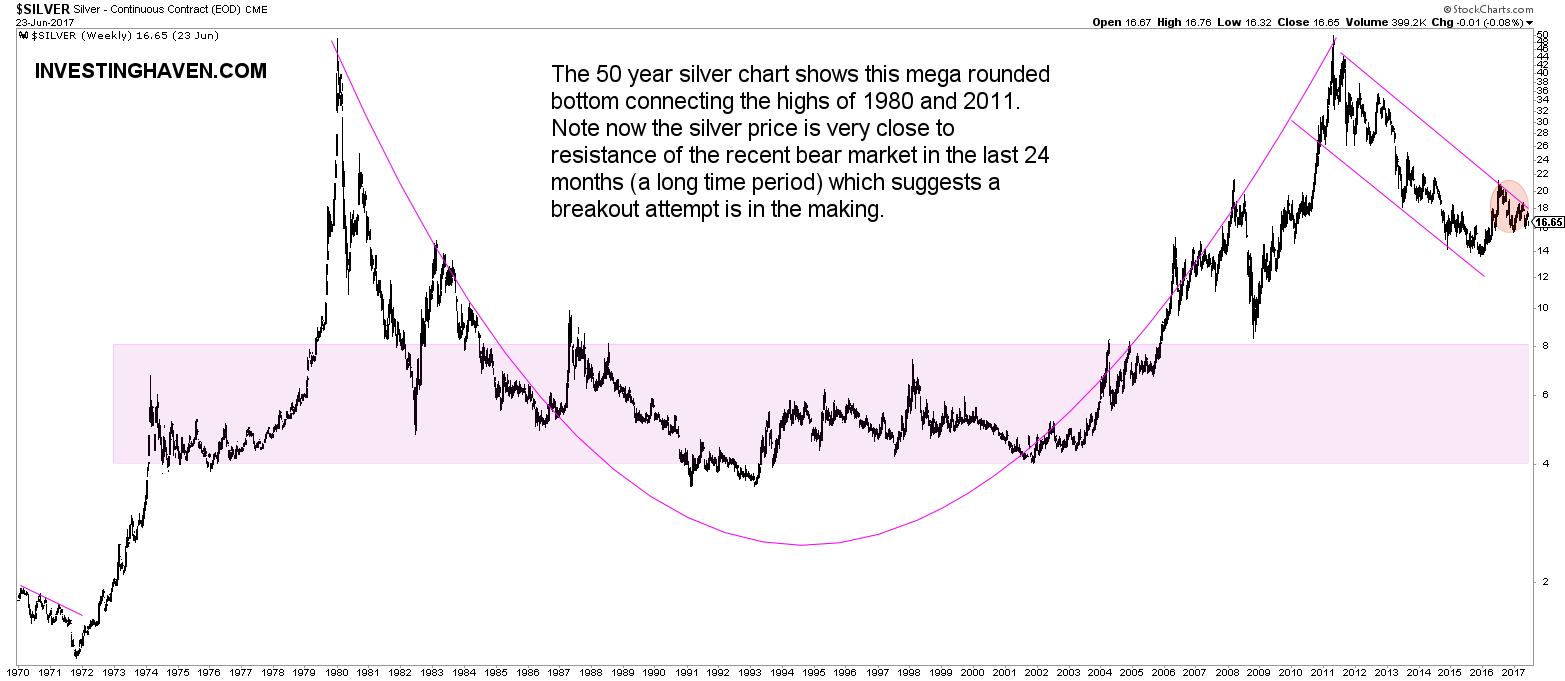
The 50 year silver chart close to a breakout in 2018

On the longest possible timeframe the silver chart looks increasingly constructive. Note how the above explained observations looks when zooming out.

Also, note the very long term cup-and-handle formation.

Both combined confirms the pressure cooker effect, even on the very long term.

silver chart 2018

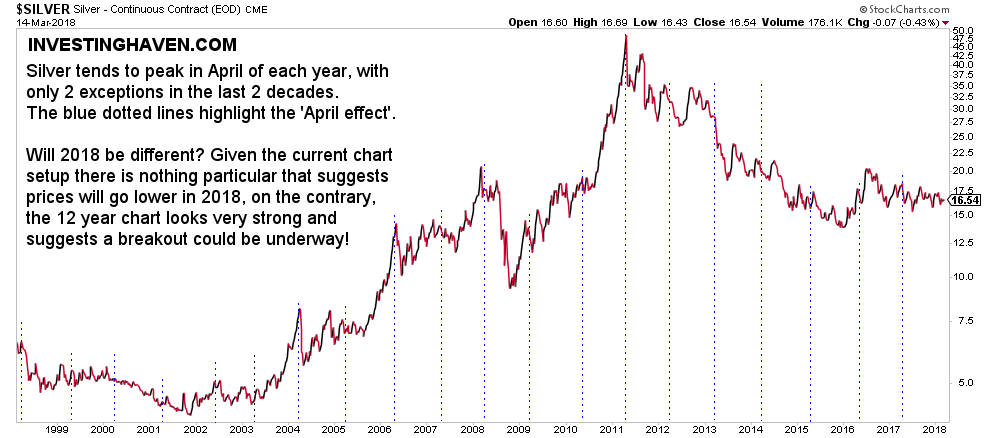
Will the 2018 silver chart be different?

Last year, we were on Marketwatch with our silver forecast “Why silver may have already peaked for the year“. That was in April, and our forecast was that silver peaked in April for the year. We were spot-on.

This year, however, with the above observations and with the unfolding pattern, we are not as convinved as last year that silver has seen the highs of the year.

Will 2018 be different for silver? That may well be the case for reasons outlined in this article, and annotated on the chart below.

silver chart 2018

10-YEAR ANNIVERSARY OFFER: InvestingHaven.com celebrates 10 years. Temporarily, you can enjoy a discount on our premium gold/silver and crypto reports. Or you can become a VIP member. Go to our anniversary deals >>
Receive our weekly newsletter.

premium service SP-500 premium service trade alerts premium service crypto teaser 

No related posts.

Tags: SILVER
Taki Tsaklanos

Taki Tsaklanos

Taki has +15 years of experience in global markets. He is passionate about forecasting markets - he calls it THE ART OF FORECASTING. His analysis methodology is unique and effective, yet easy to understand; it is based on chart analysis combined with intermarket / fundamental / sentiment analysis. His work appeared on major financial outlets like FinancialSense, MarketWatch,Twitter: twitter.com/investinghaven

Leave a Reply Cancel reply

Your email address will not be published. Required fields are marked *

Connect with InvestingHaven

Receive top notch forecasts for free.

*We hate spam as you do.

Site Navigation

  • RSS Feed
  • About us
  • Advertising
  • Sponsored Content Policy
  • Mission 2026
  • Sitemap
  • Privacy & Disclaimer
  • Terms of Service
  • Contact Us
investing haven logo

Precious metals market analysis including gold and silver price predictions. Crypto market analysis including highly accurate BTC ETH SOL XRP forecasts.

Copyright © 2025 InvestingHaven

Login to your account below

Forgotten Password?

Fill the forms bellow to register

All fields are required. Log In

Retrieve your password

Please enter your username or email address to reset your password.

Log In

Receive top notch forecasts for free.

*We hate spam as you do.

No Result
View All Result
  • News
  • 2025 Forecasts
    • 10 market predictions
    • Dow Jones forecast 2025
    • S&P 500 forecast 2025
    • Nasdaq prediction 2025
    • Best crypto to buy now
    • Which crypto will explode
    • Best altcoins to buy
    • 15 crypto forecasts 2025
    • Which precious metal to buy
  • Silver articles
    • Silver prediction 2025 – 2030
    • Will silver exceed $30?
    • When will silver hit $50?
    • Can silver hit $100?
    • Silver shortage
    • 50-year silver chart
    • Silver bullish reversal
    • Silver seasonality charts
    • How to invest in silver
  • Gold
    • Gold prediction 2025 – 2030
    • Will gold set new ATH?
    • Will gold hit $3,000?
    • Can gold hit $10,000?
    • Gold chart 10 years
    • Gold chart 50 years
    • Gold chart 100 years
    • Gold silver ratio
    • Gold seasonality charts
  • Commodities
    • Sugar forecasts
    • Coffee forecasts
    • Nickel forecasts
    • Lithium investing
  • Crypto news
  • Crypto forecasts
    • BTC prediction 2025 – 2030
    • ETH prediction 2025 – 2030
    • SOL prediction 2025 – 2030
    • XRP prediction 2025 – 2030
    • XLM prediction 2025 – 2030
    • BNB prediction 2025 – 2030
    • ADA prediction 2025 – 2030
    • AVAX prediction 2025 – 2030
    • KAS prediction 2025 – 2030
    • NEAR prediction 2025 – 2030
    • BCH prediction 2025 – 2030
    • LINK prediction 2025 – 2030
    • DOT prediction 2025 – 2030
    • SUI prediction 2025 – 2030
    • ICP prediction 2025 – 2030
    • LTC prediction 2025 – 2026
    • STX prediction 2025 – 2030
    • DOGE prediction 2025 – 2030
    • SHIB prediction 2025 – 2030
    • PEPE prediction 2025 – 2030
    • FLOKI prediction 2025 – 2030
    • WIF prediction 2025 – 2030
    • ONDO prediction 2025 – 2030
  • Premium Crypto Alerts
  • Premium services

Copyright © 2025 InvestingHaven