Flying in the air for a couple of hours as passengers, with friendly and caring stewardess, may feel free, but the underlying nature of this business is as hard as anyone can imgine. Besides the competition between well known international airlines, the pressures coming from budget airlines is shaping an ultra-competitive environment resulting in a price war.
The cyclical nature of this industry forces companies to downsize or re-arrange personnel every time airlines tend to record consecutive losses in their financial reports.
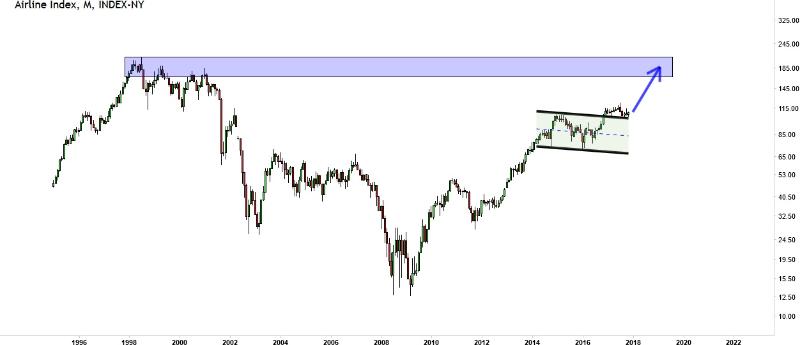
Strangely, despite such a gloomy scenario, the chart of the airlines index –XAL – is sending the opposite signal right now.
The monthly chart of the XAL index was persistently down until 2008 after which it started to make a V-shaped recovery. And for the past two years, it has been consolidating. It appears now that XAL is morphing into a potential bull flag. Watch the chart, and pay special attention to the recent V cup bottom.
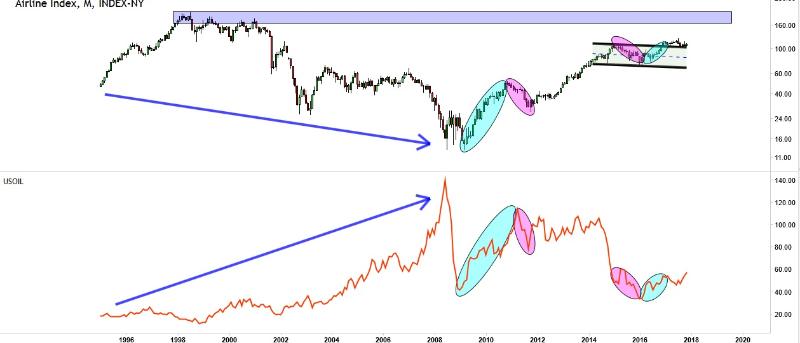
Before deep-diving into specific airline stocks we want to bust the myth that “when oil prices go up airline stocks go down due to lower revenues.” In the monthly chart below, the airline index is shown at the top while the monthly oil price chart is shown in the lower pane. Before 2008, higher oil prices were pushed down airline stocks. However, as of 2008 the highlighted areas show that oil prices can go up or down in tandem with airline stocks.
Good to know, Warren Buffett has 3 airlines in his portfolio over at Berkshire Hathaway. Note that the SEC disclosure was a quarter late reporting it though. The fact that Warren Buffet has airlines does not necessarily mean something because he too has had many losers in this portfolio.
Be careful interpreting that a stock is worth buying because a famous investors holds it. That is why we ALWAYS verify markets and individual stocks based on price charts.
Two stocks stand out as we screen many dozens of airlines stock charts.
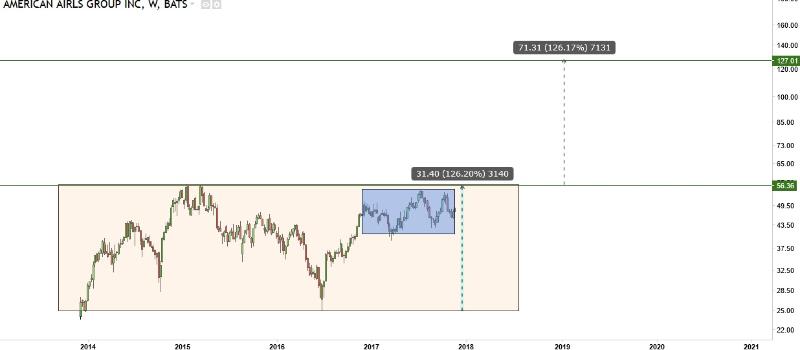
The weekly chart of American Airlines Group (AAL) shows that price has been consolidating in the rectangle box (see below). At the time of writing AAL is trading at 48.6. Our conservative target is that price will reclaim ~56.35 by end of 2018. The ultimate target of ~127 beyond 5 years will be a function on how lucrative the business will be going forward.
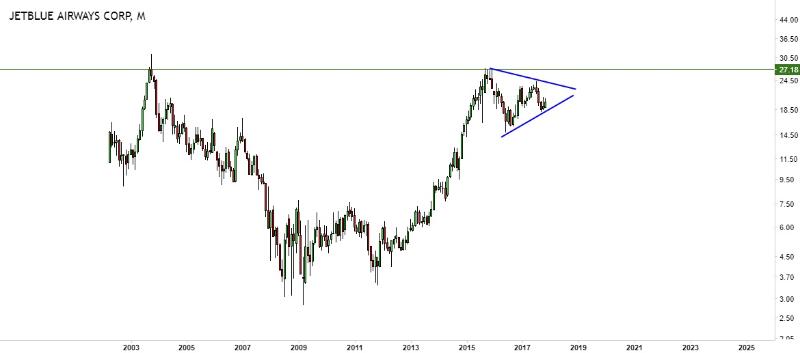
Jetblue Airways Corp (JBLU) is in the midst of forming a triangle, which we reckon is a low risk entry point with a target of ~27 by 2018. In case the price breaks above 27 in a convincing way we expect it will hit 40. Otherwise a nasty break down can half the price to ~9.40!
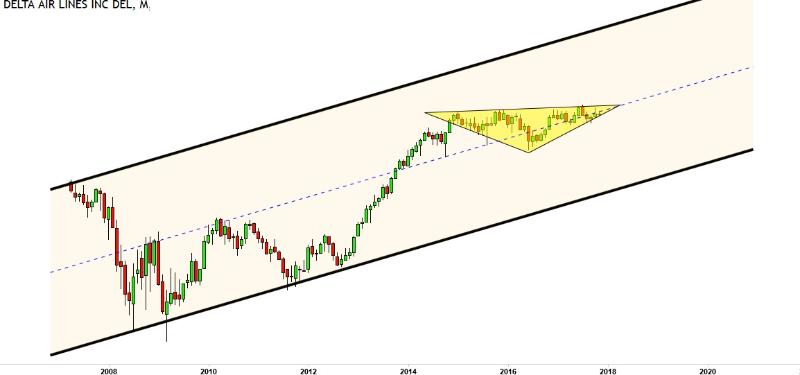
Lastly, the monthly chart of Delta Airlines (DEL) is going through a consolidation mode. Downside major support comes in at ~33.7 but we foresee price moving upt ~60 by end of 2018.
Note that airlines are cyclical and seasonal, invest accordingly and take into account your own risk profile.


