Emerging market stocks were among the outperformers in 2016. But what will 2017 bring? In line with our usual format, we do an emerging markets forecast for 2017 in which we focus on chart patterns and intermarket dynamics.
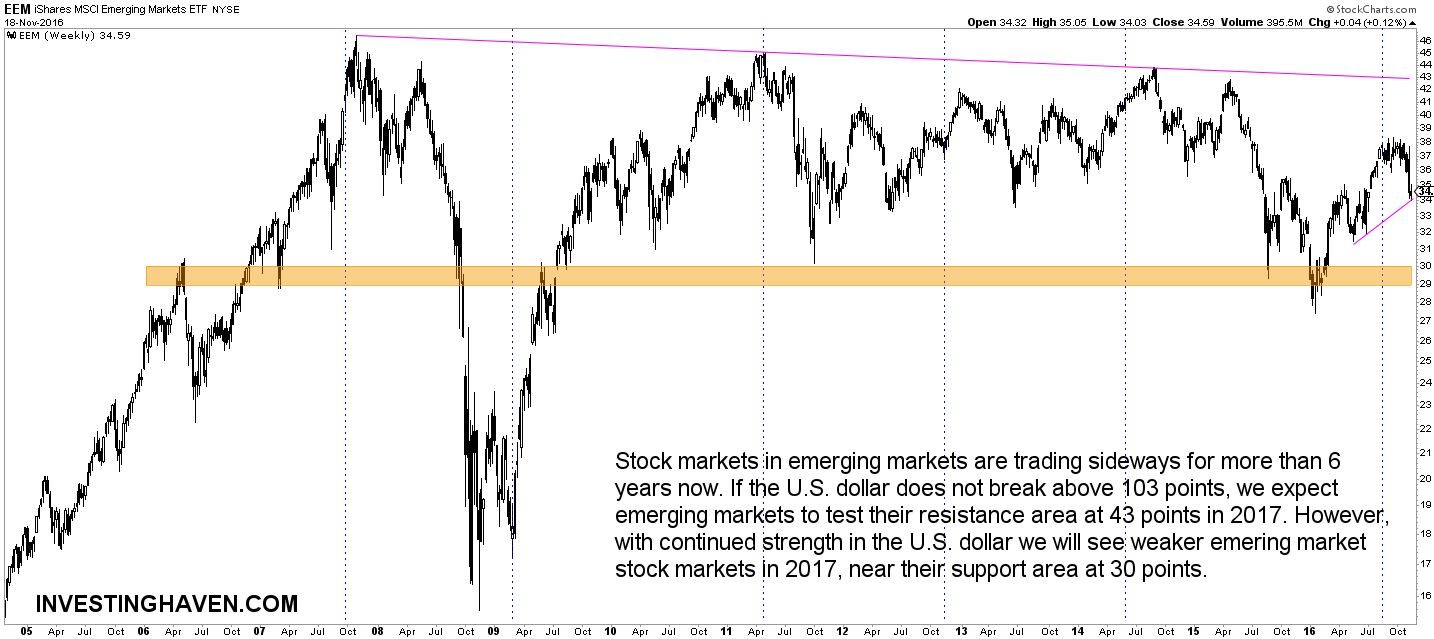
First, the chart of emerging markets, represented by the EEM ETF, looks pretty flat over the last 6 years. The first chart below shows a long term view of EEM, with a concise support area (orange) and resistance line (pink). The vertical dotted lines represent major phases in broad (global) markets, alternating risk on and risk off. Note that those phases did not impact emerging markets stocks with the exception of the 2008 collapse.
As seen on the chart, there was a false breakdown early 2016, followed by a strong bounce. Currently, EMM is trading halfway the range.
Emerging markets forecast for 2017 will largely depend on the U.S. dollar
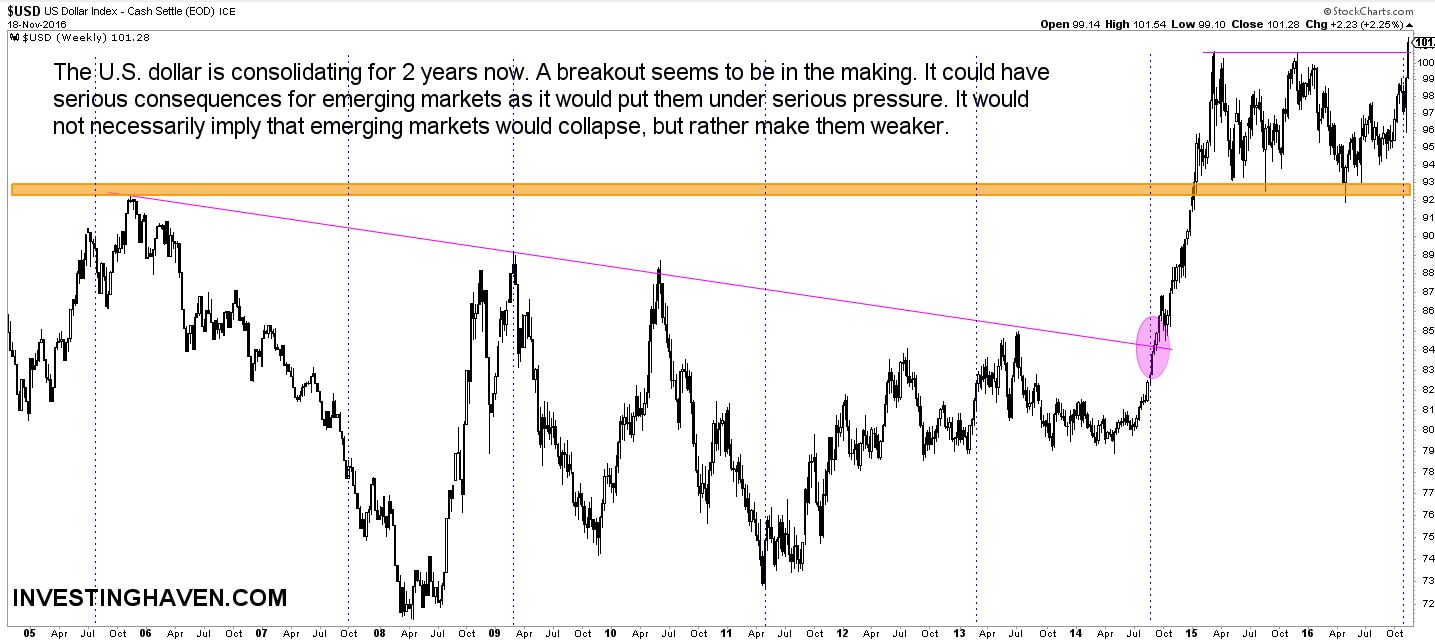
One of the important drivers of emerging markets stocks is the U.S. dollar. As seen on the next chart, showing a long term view of the dollar, there is a clear link between both assets. Basically, the dollar traded sideways between 2006 and 2014. It was in the summer of 2014 that the dollar broke above its trendline, and rose in a very short period of time above its secular resistance area (orange line). As a consequence, emerging market stocks felt pressure, and they slightly collapsed from 43 to 28 points this year.
For 2017, our emerging markets stocks forecast really depends on what the dollar will do at current price levels. The dollar is about to break out now. If strength continues in the dollar, we see EMM decline to 28, its support area. We cannot image EMM to fall lower, so 28 points is our worst case scenario.
However, if the dollar weakens from here, and only rises moderately, we see EMM rise to its resistance line at 43 points. That is our bullish forecast Chances are high that EMM could break out. Such an event, given its long sideways trading, would be significant. Emerging markets will attract a lot of interest from the investment community, which will feed the bullishness.
The line in the sand is 103 points in the U.S. dollar index.


