A stock market crash in 2018? Yes, very likely, because several market indicators flashing red. This is why.
[Ed. note: at the bottom of this article we added a section on the October 2018 stock market crash and what it may imply going forward.]
The U.S. stock market is in an amazing shape. Every day new all-time highs are set. This MUST be bullish, and investors should go all-in, right? Well, not that fast, at least not in our opinion. We see many signs that this rally is getting overextended, from an historical perspective. While we clearly said a year ago that we were bullish for this year, we did not see any stock market crash coming (a year ago). Right now, we are now on record with a forecast of a stock market crash in 2018, and it could take place as early as the first weeks / months of 2018.
So far, in all openness and transparency, our warning signals for a mini-crash in the stock market in November were invalidated. We were horribly wrong in terms of timing. However, we still believe that there is a huge risk brewing for a mini-crash. The stronger the current rally, the stronger the fallback.
Yes, we do expect a strong mini-crash in the stock market in 2018, starting early 2018. Central banks will likely step in to avoid a similar chaos as in 2008/2009, so we don’t forecast the end of the financial system.
We do however believe a very stiff correction will take place which potentially could bring a buying opportunity (to be confirmed at that point in time based on intermarket dynamics). More likely, however, we believe that money will rotate out of U.S. stocks into emerging markets. That is why we are very bullish emerging markets in 2018.
The first warning signs of a stock market crash in 2018
We published the following warning signs starting in August:
- Is Volatility Making A Higher Low Here?
- Volatility On The Rise As Expected. What’s Next For Stocks?
- Ignore This Series Of Volatility Warning Signs At Your Own Peril
- Volatility Hit Historic Lows This Week. Maximum Complacency Is Bearish!
But the number of concerning indicators is accumulating now. Yes it may sound as foolish as it can be, that, right during a strong bull market rally, InvestingHaven’s research team talks about concerning indicators. But let’s first deep-dive before you come to a conclusion.
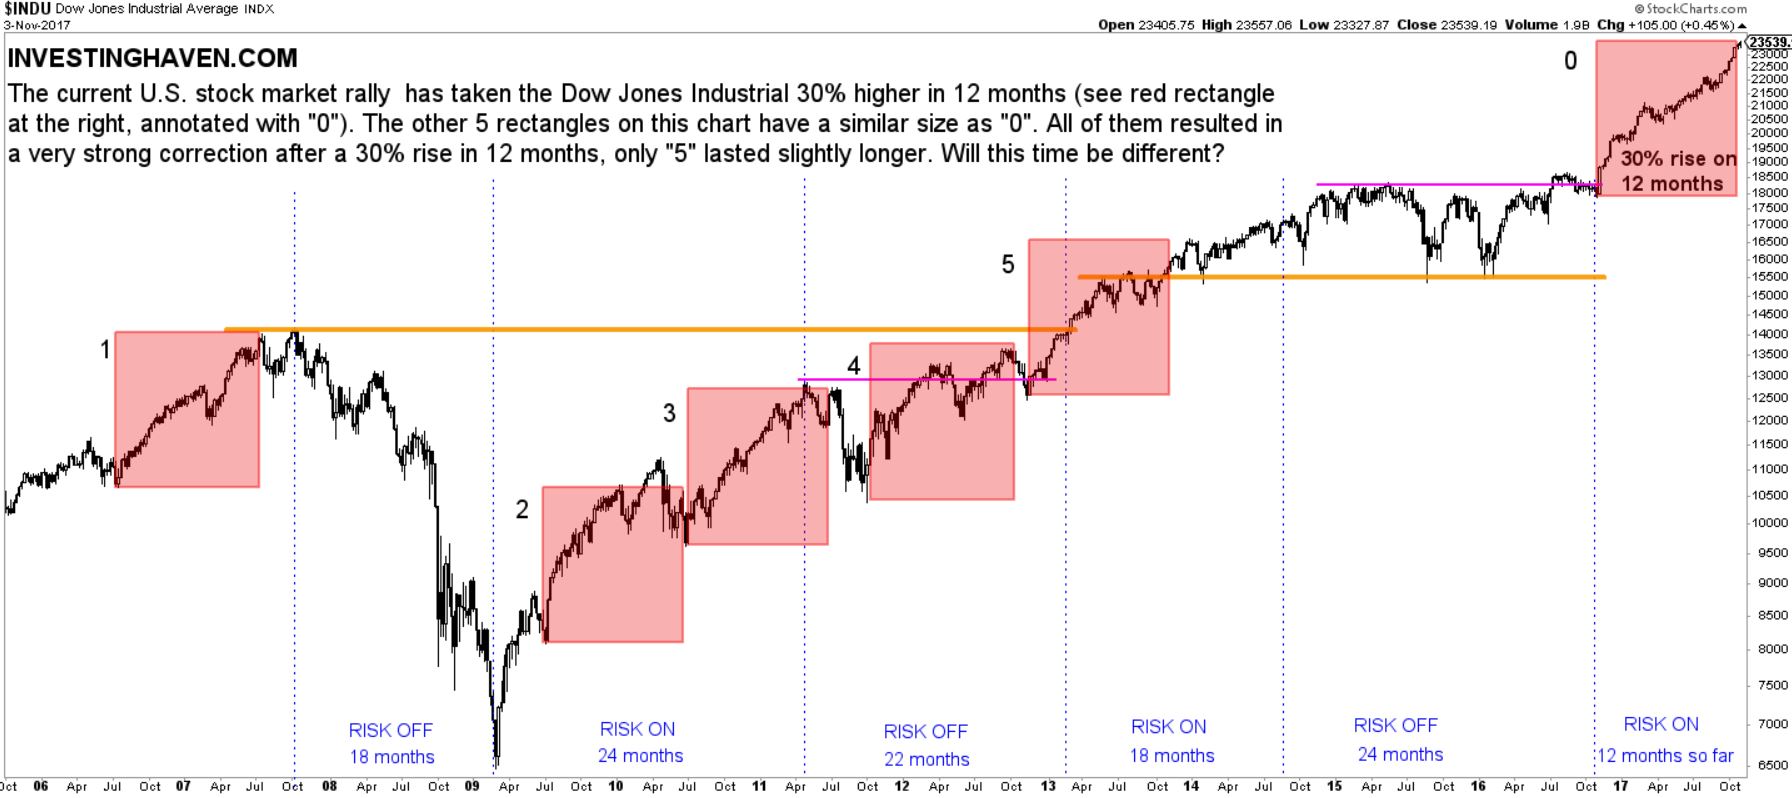
The Dow Jones Industrials (DJI) chart is one of those concerning charts. The area indicated with “0” shows that the index has risen with more than 30% in 12 months, without any meaningful correction. This rally may be amazing, but it is reaching a level never seen before in the last 12 years (including the 2007 rally and major top). All other instances of a 30% rise in 12 months are indicated on this chart (from 1 till 5):
- The 2013 rally (“5”) was as powerful as the current one, but resulted in a mini-crash just 3 months later.
- All other rallies (“1” till “4”) resulted in a strong correction or mini-crash within or right after their 12 month rally.
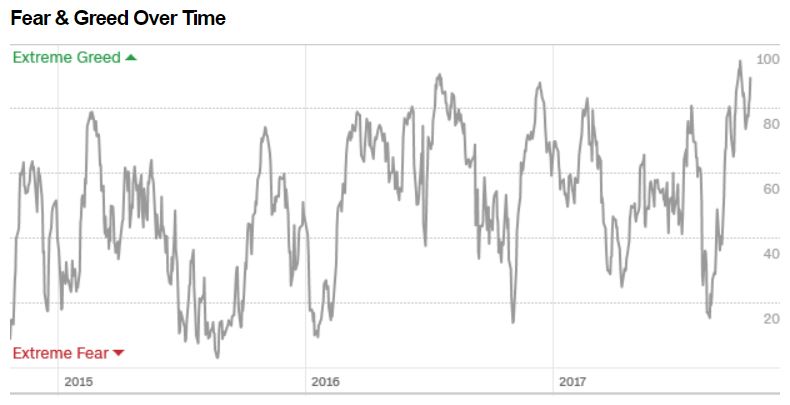
The current U.S. stock market sentiment shows extreme greed according to the CNN Money fear & greed index.
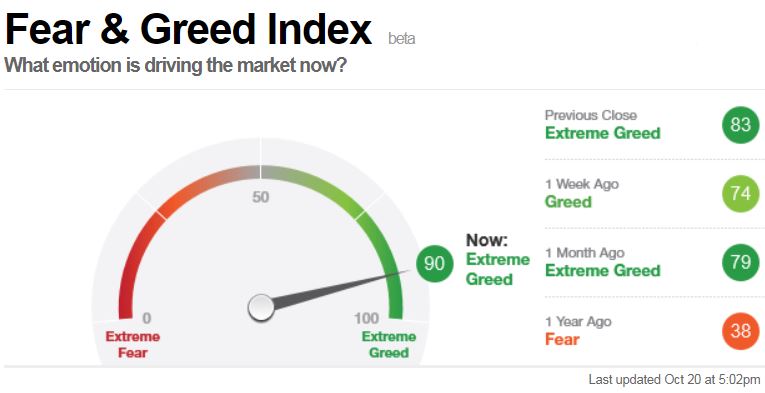
In the last 3 years the Fear & Greed index reached similar levels of bullishness only twice. This bull run is overextended on the short term timeframe for sure.
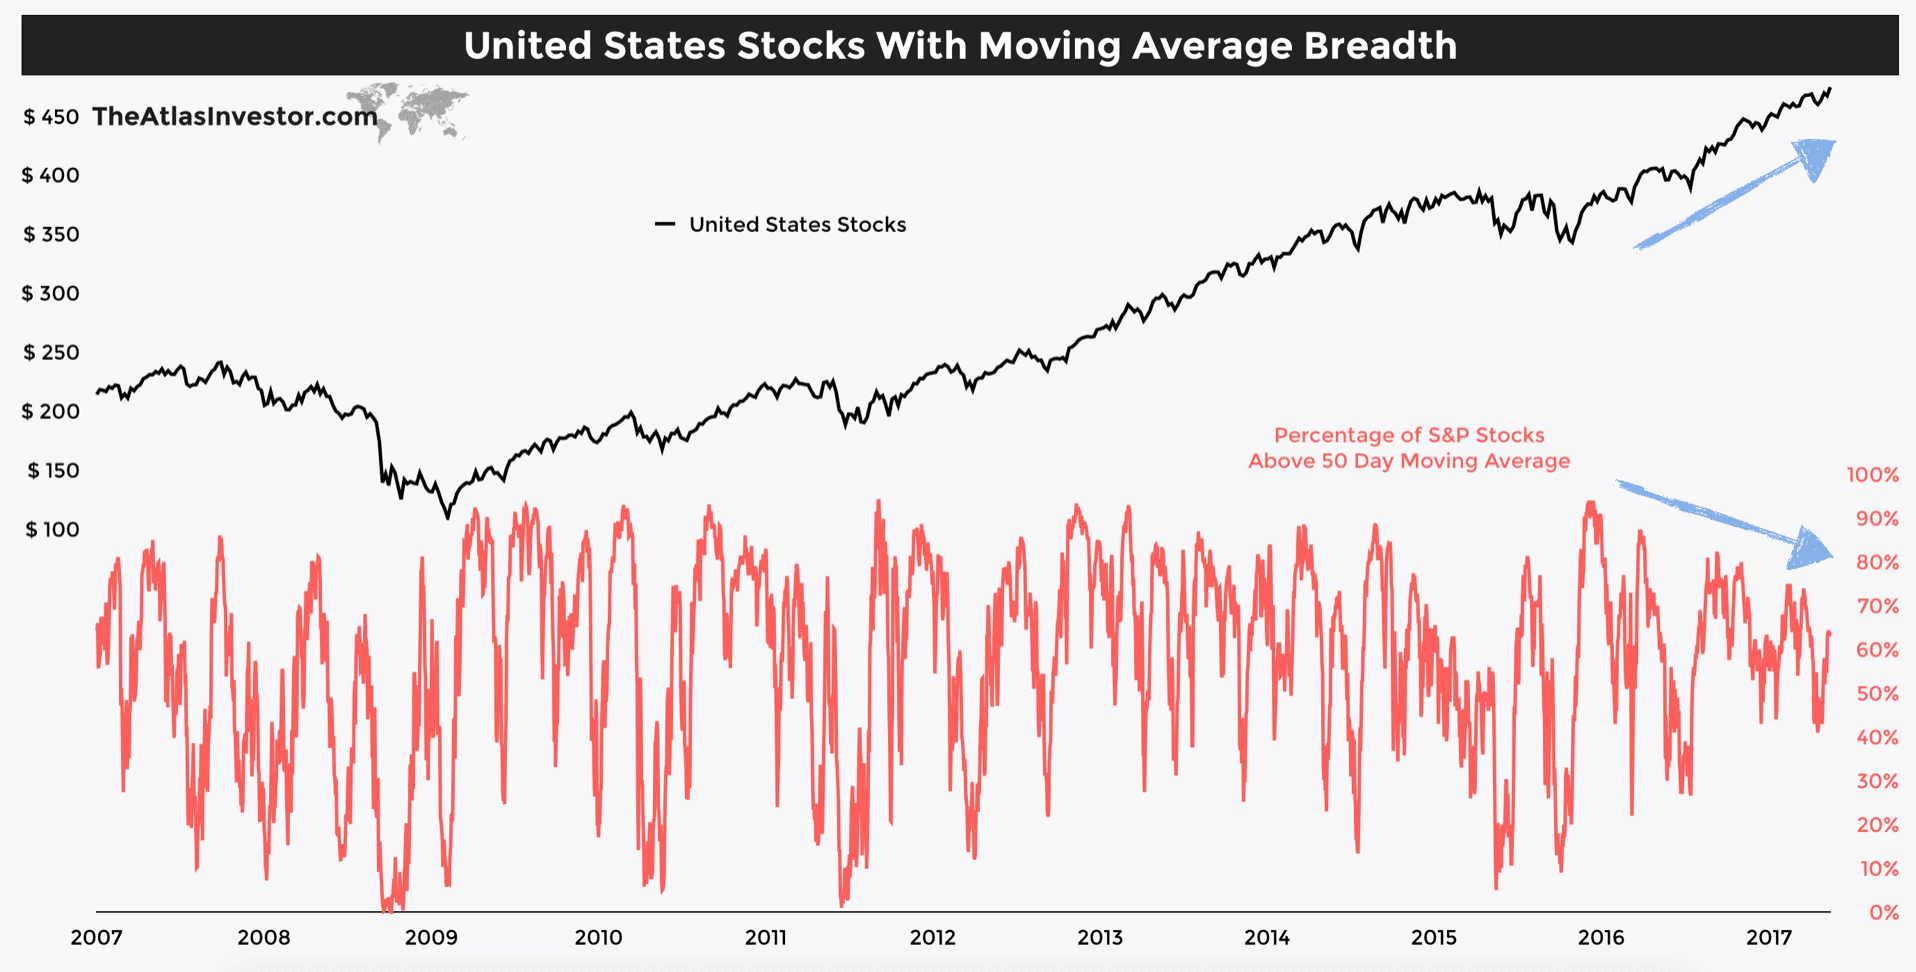
The stock market breadth, an indicator of strength of market internals, is suggesting that this rally is driven by a minority of stocks. As the broad indexes move higher there are less stocks participating in the rally. Not a good sign.
4 charts suggesting a stock market crash in 2018 based on historical data
Let’s put the current stock bull market in historical context. As the charts speak for themselves we believe they suggest a stock market crash is brewing, and it could start as early as the first days or weeks of 2018.
The first chart shows the strongest bull markets in the last 80 years. Visibly, the current bull market which started in 2009 is now close to being the strongest ever. The current strong rally which comes after an 8-year bull run is a concerning factor, according to us.

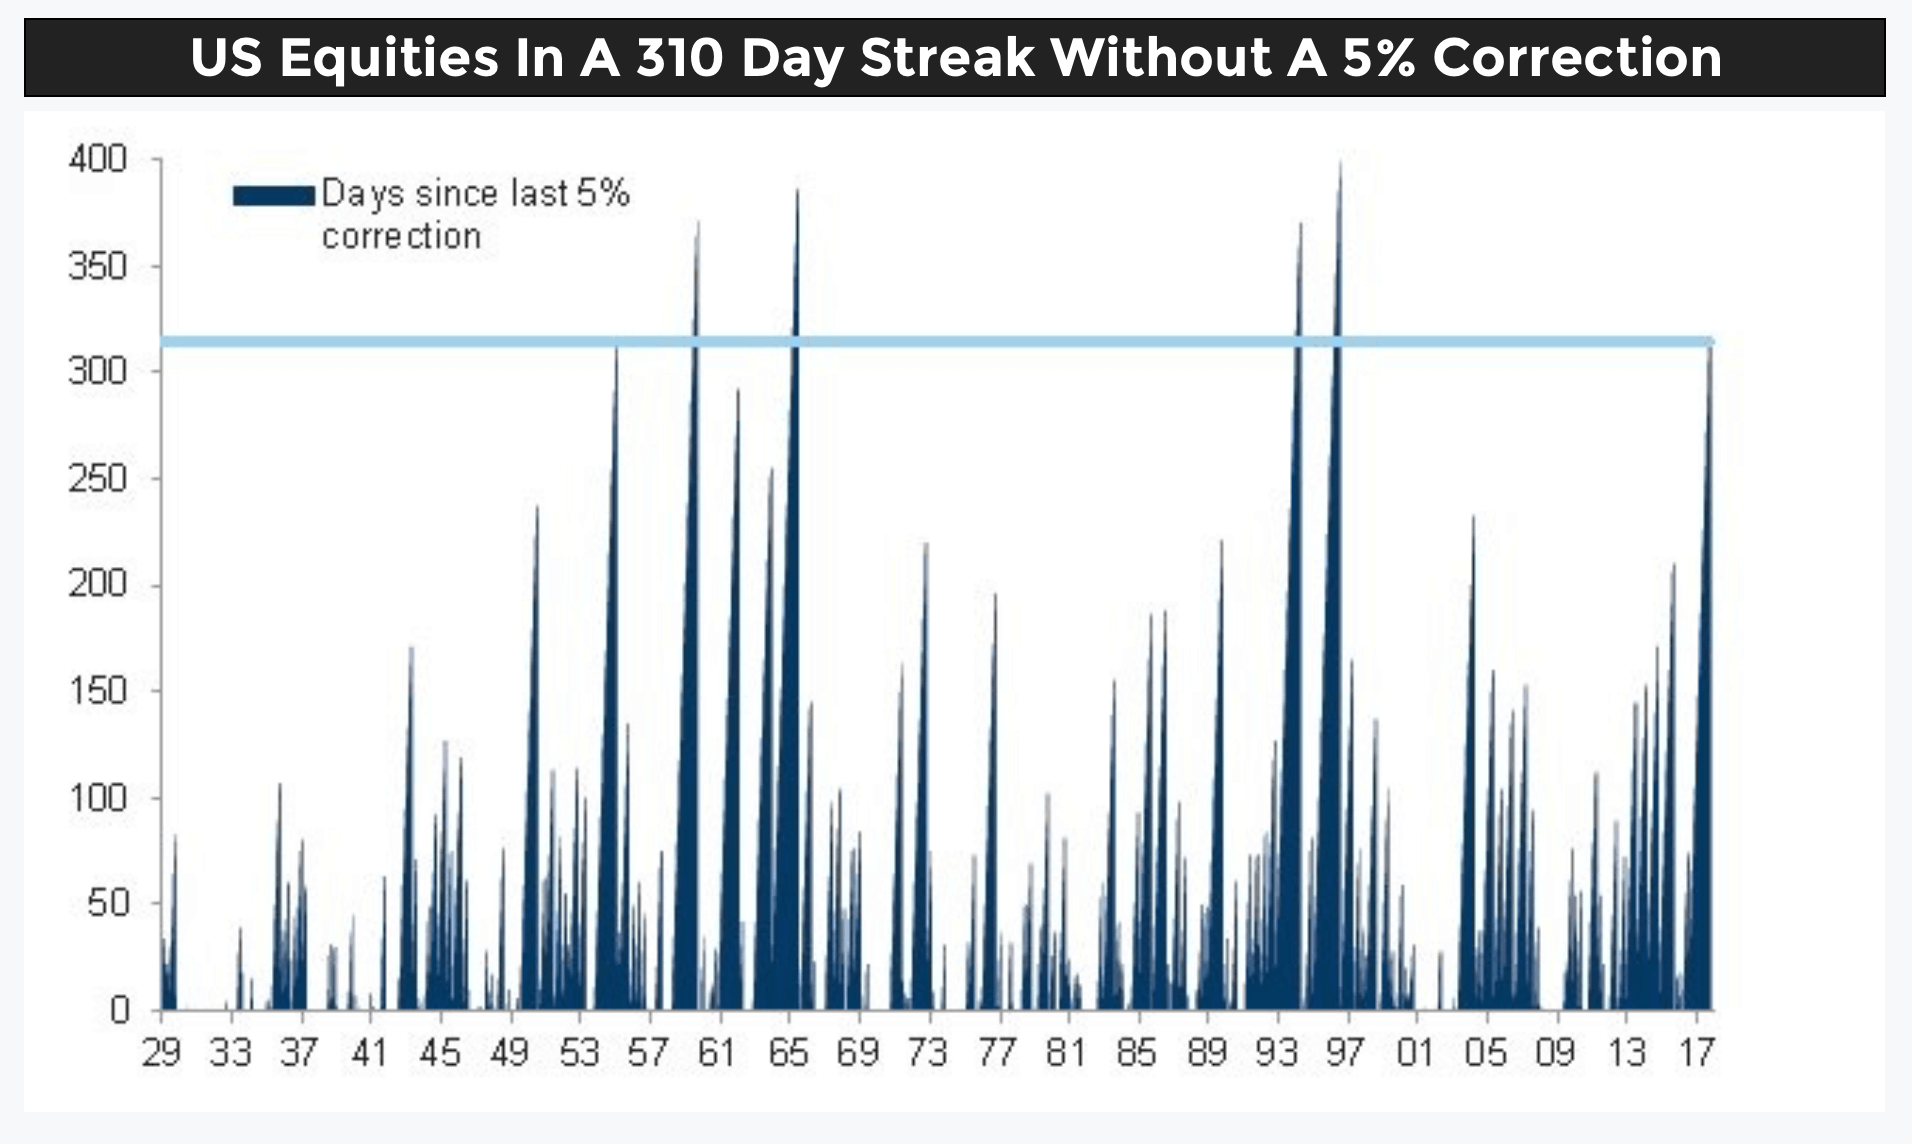
The second historical chart shows the number of times U.S. stocks were in a 310 day rise without a correction more than 5% over the last 100 years. This only happened 4 times before in 100 years. Is this a time to get bullish or cautious, we leave that question to readers?
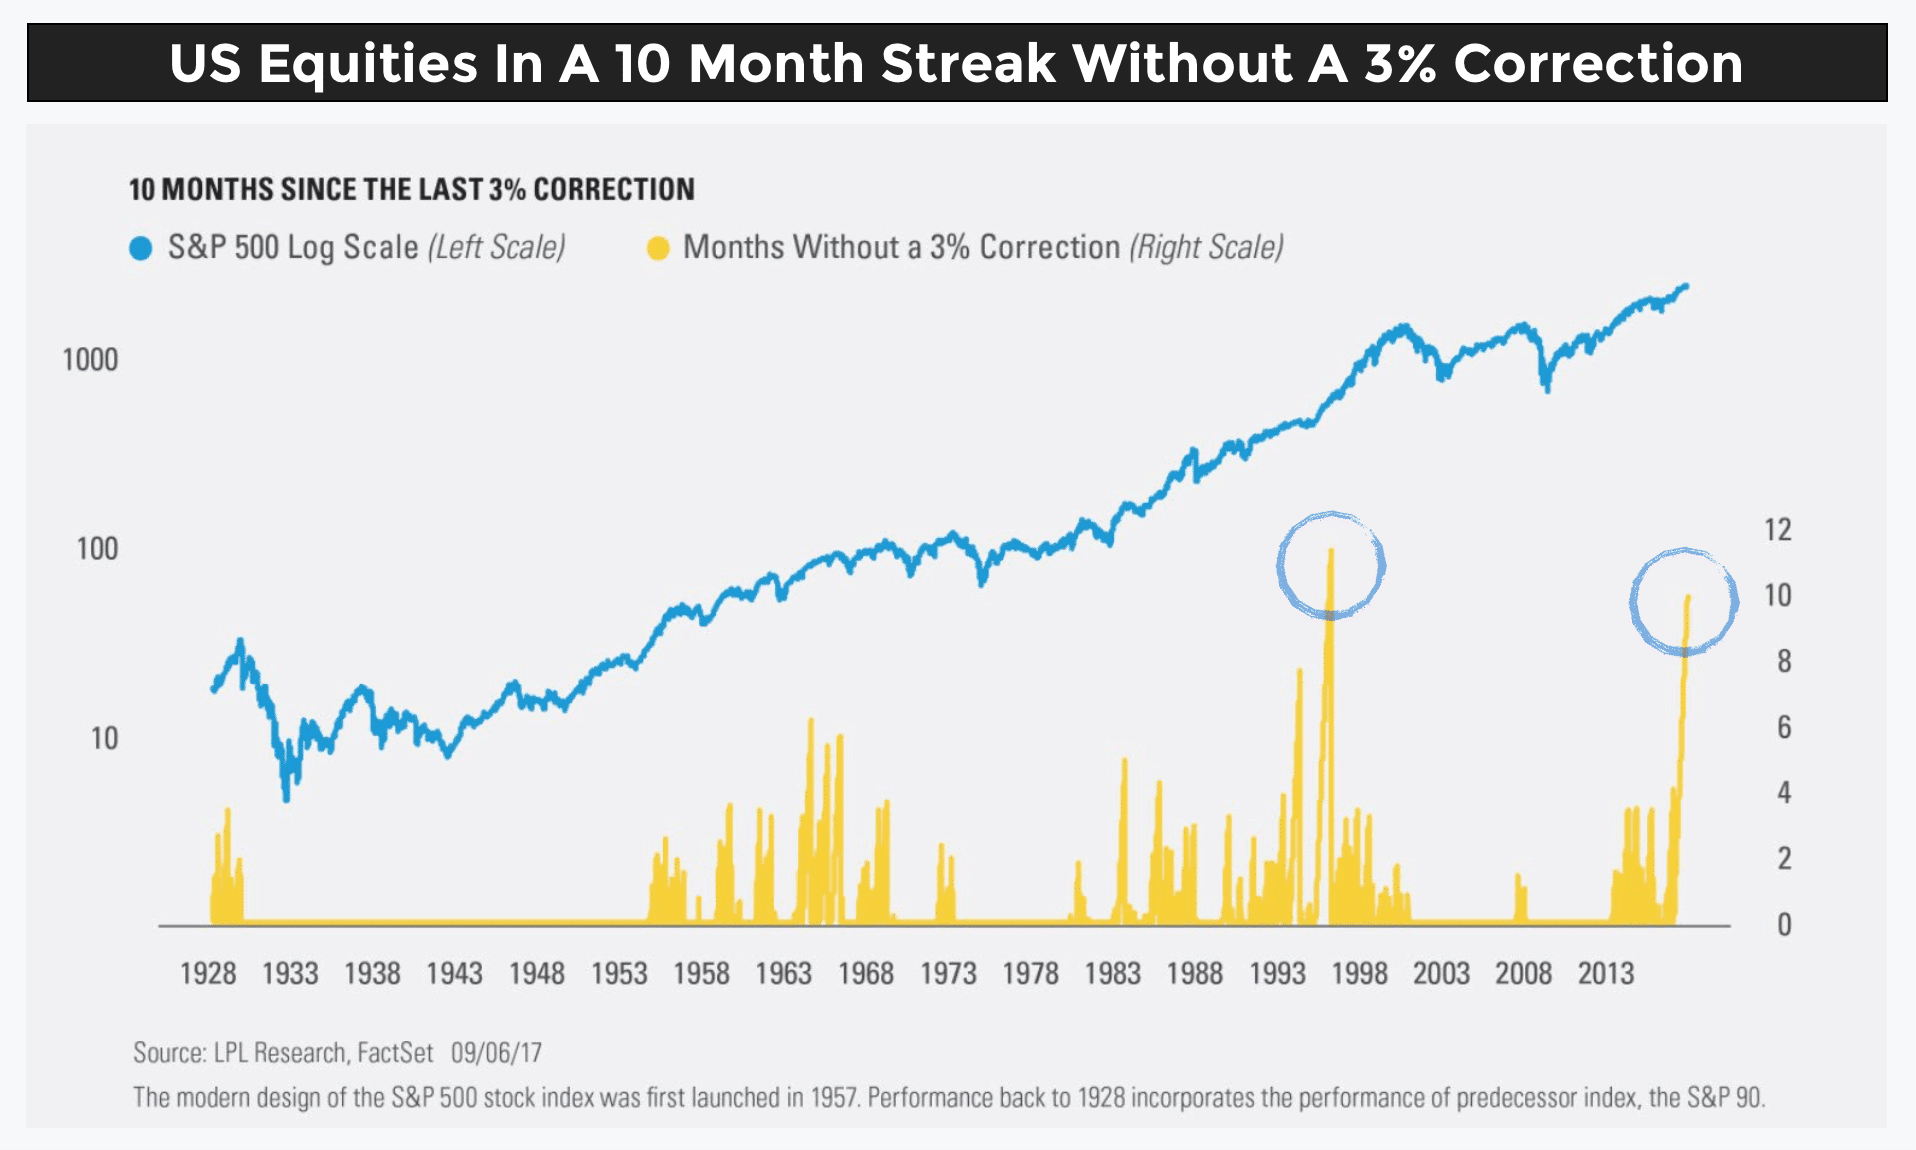
Similarly, U.S. stocks rising for 10 months without a 3% correction has only happened once before in 100 years. Is this a new normal? Potentially, but would you be aggressive or cautious on U.S. stocks at this point?
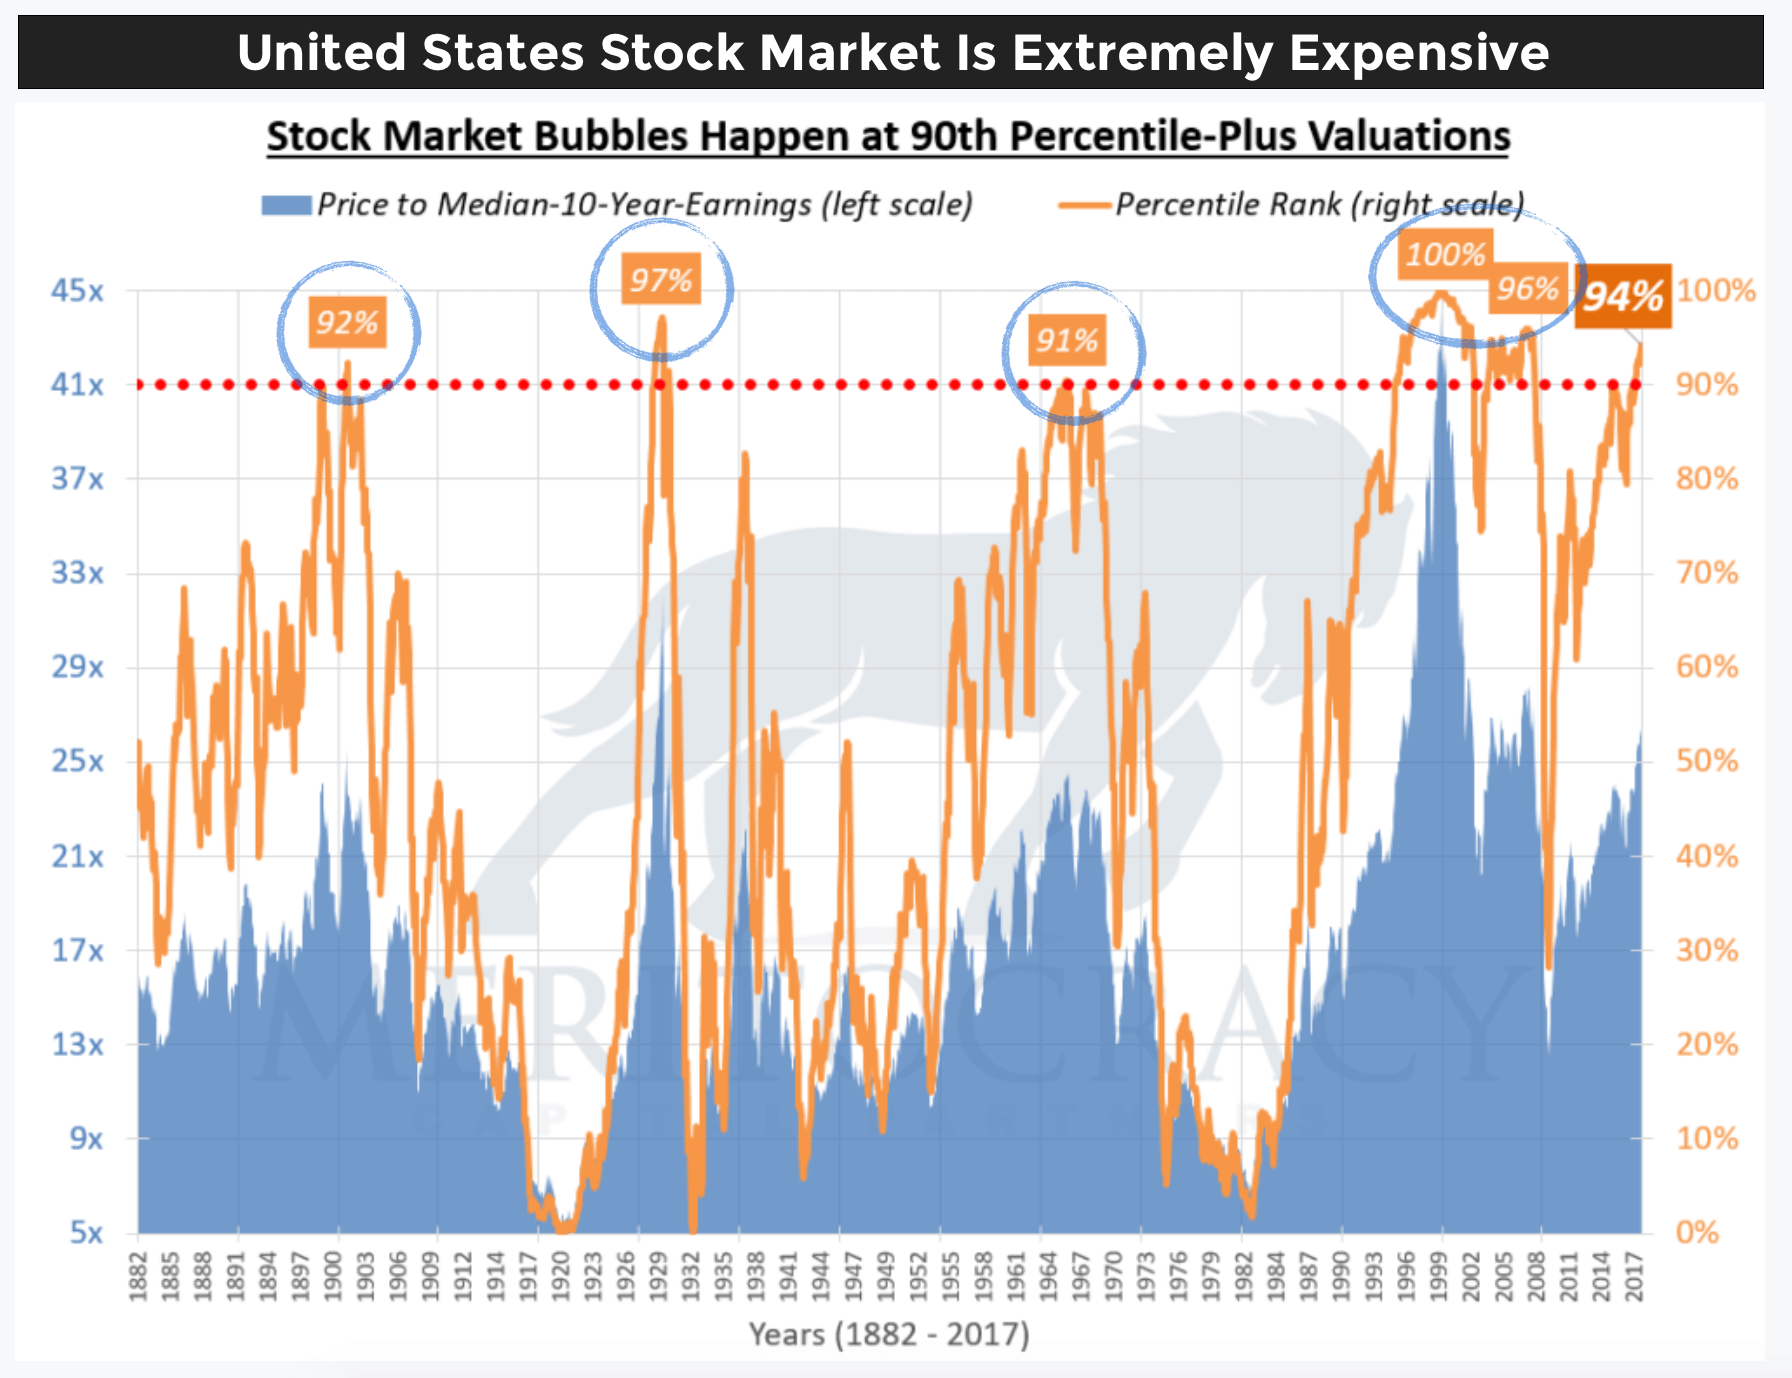
The last chart is truly impressive, readers can consider this a bonus chart. The U.S. stock market has a price to median-10-year-earnings ratio of 43x. It is the 4th time that valuations are that high in the last 130 years! Every time this valuation indicator got over 90% percentile-plus valuations it got followed by a crash.
[UPDATE on October 12th 2018]
Stock market crash 2018 starting in October 2018
In the week of October 8th 2018 global stock markets led by the U.S. stock markets sold off heavily. Is this the start of 2008-alike stock market crash? In other words is this THE start of THE stock market crash 2018?
We don’t think so.
On the one hand there has been ‘proven’ damage on the uptrends that started in the summer of 2016.
However, there is strong support between 5 and 10 percent below current levels, say the 2009 uptrend support although not seen on any chart in this article.
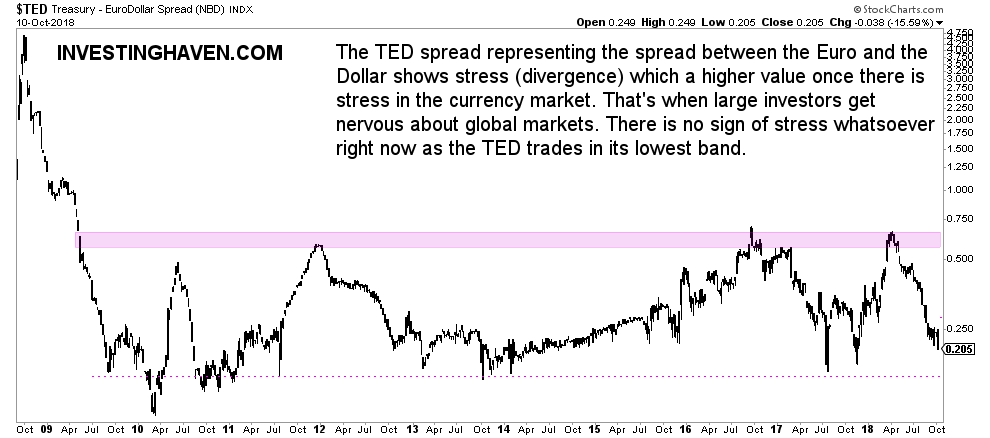
At the same time we would have seen turmoil in currency and credit markets if this was a 2008 or 1987 repeat. It’s not there, nothing is happening in currencies nor in credit markets. The only thing that happens is the bond market is selling off.
To illustrate this we have included the TED spread which is a good stress indicator for credit and currency markets. That’s where turmoil always starts before it trickles down to other parts of global markets like for instance stock markets. It is “the difference between the interest rates on interbank loans and on short-term U.S. government debt.” TED is an acronym formed from T-Bill and ED, the ticker symbol for the Eurodollar futures contract. It incorporates both interest rates and currency stress. But as seen on below up-to-date chart there is no stress whatsoever.
Our conclusion? No, THE stock market crash 2018 did not start. There is more downside potential in the next few weeks but based on current market conditions it is not a cataclysmic stock market crash that is underway.