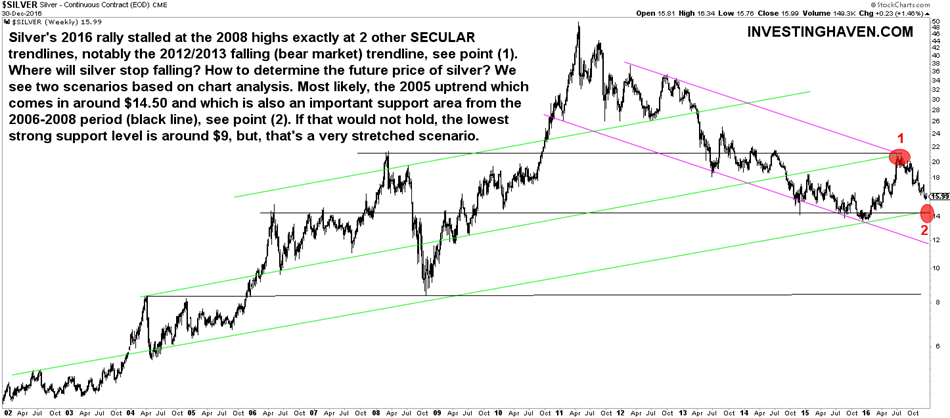
We made our point about the 2017 price of silver a while back, and we said we had a bearish stance for at least the first period of 2017.
Earlier this week, we wrote this article about silver: Silver Price Undergoing An Important Test. We made the point that silver is testing its falling bear market channel. One of our readers rightfully asked this question:
A month ago you said, “It points to $14.50 as a future price of silver. We believe that price will be reached in 2017.” Are you changing your view now?
Great question, and we decided to write detail our thoughts in this post.
Shorter term silver price
First and foremost, our long term view of $14.50 silver is based on its long term chart. The most important thing in chart analysis is the choice of the timeframe(s).
We add two silver price charts in this article: the weekly chart on 5 years and the weekly on 15 years.
The 5-year chart shows this breakout from the falling channel, and the current test. This is important information for investors (traders) on the shorter term. Depending on how the price of silver behaves around $15.50, it could offer shorter term trading opportunities. Typically, those type of important price points tend to be broken violently, after some period of testing.
However, it is not because the $15.50 is important, that it is our price target. Our silver price target is derived from the longer term chart in combination with gold’s price chart because we believe gold is the leading indicator within the precious metals complex (at least, it has the tendency to be the first to signal a turnaround from bear to bull market).
The first longer term silver price target is $14.50
Silver’s long term chart below shows a rising trend (green lines) and the recent falling trend (purple lines). The key thing to understand in analyzing gold and silver prices is that they always tend to move within channels, certainly during bear markets. We look for price points where several important trends arrive at one specific price point. Price point (1) on the chart was important as it halted silver’s rise, and we saw that coming in the summer (we warned our readers in time).
The next important price point is indicated with the number (2) on the chart. There is no support between the current price and price (2). If (2) does not hold, there is little in the way until $11.50 and $9. That is a stretched scenario though, but never say never in markets.
Another ‘reason’ why we believe silver will fall to at least $14.50 is that gold is nowhere near an important support level. We believe the area around $950 to $1000 will provide huge support, and that’s our first target. For convenience, we add gold’s long term price chart with annotations we haven’t shared before (it’s the first time we reveal this gold chart which we consider the most important one in our long chart list).


![[:en]silver price 2017[:nl]zilver prijs 2017[:]](https://investinghaven.com/wp-content/uploads/2016/12/silver_price_2017.png)
![[:en]gold price long term chart[:nl]goud prijs lange termijn grafiek[:]](https://investinghaven.com/wp-content/uploads/2016/12/gold_price_long_term_chart_till_2017.png)


