We do not cover the uranium market often, but, admittedly, this forgotten stock market segment looks increasingly more attractive. There is bullish momentum brewing in this sector. The segment of uranium stocks in 2019 might be one of the outperformers. In this uranium stocks forecast for 2019 we will look at the underpinning uranium spot price as well as 3 top uranium stocks.
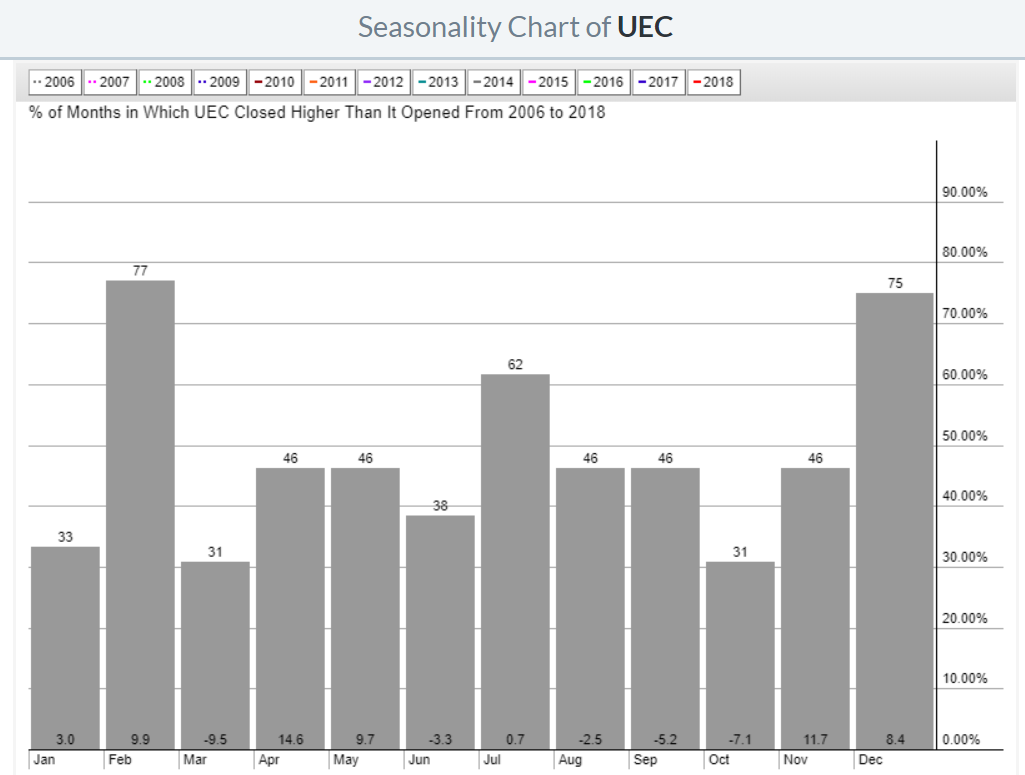
The uranium market is quite cyclical in nature. The strongest months of the year for uranium spot as well as uranium stocks (URA) are the ones around year-end.
One very important remark for our uranium stocks forecast for 2019 is of course the broader stock market, as well as this the Euro chart which will largely determine how current how global turmoil evolves. Needless to say, in a bad market scenario all uranium stocks will go down. Although we do not anticipate this we have to add this disclaimer.
Moreover, the uranium spot price is the key driver for uranium stocks. The drivers of the uranium spot price is almost a mystery, this market is quite intransparent.
That’s why we have to flash a warning at this point to take this intransparency into account. That’s why we have to develop a structured method to come to an educated uranium stocks forecast for 2019. We do so by looking at the uranium spot price chart, 3 different uranium stocks and seasonality. That’s the way we try to derive our uranium stocks forecast for 2019.
An Uranium Spot Price Forecast for 2019
The charts of the uranium spot price looks very enticing. We will look at both the historical spot price chart as well as the futures chart.
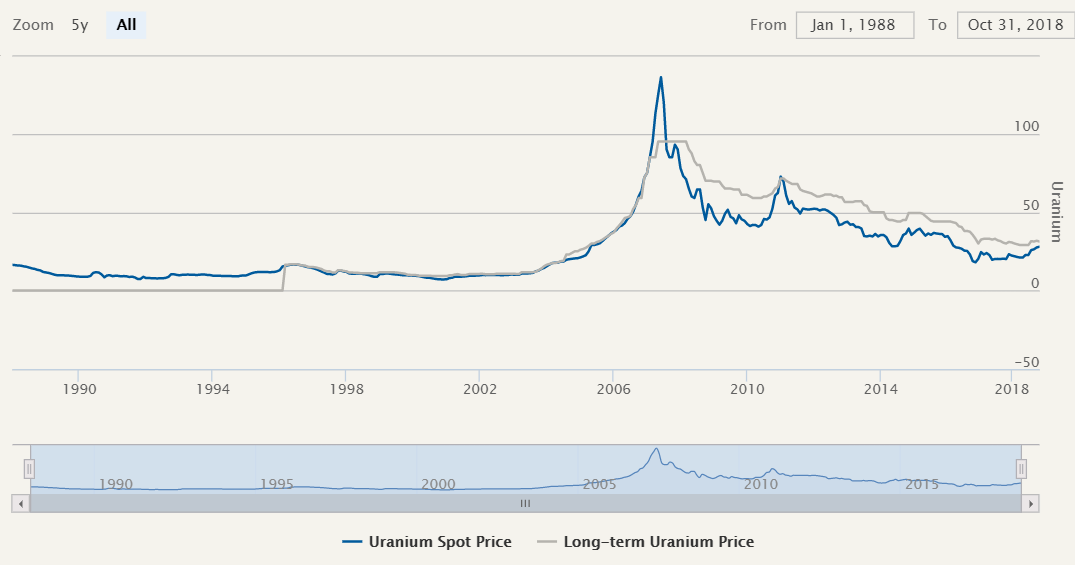
The historical chart over 30 years shows a bottoming formation. A rounding bottom which is now in the making for some 3 years is a very powerful bullish pattern.
What we learn from this historical uranium spot price chart is that the downside is very limited while the upside is significant. As always, a recovery does not happen overnight. A recovery is a process, and it first needs a solid base before a powerful bull market can start.
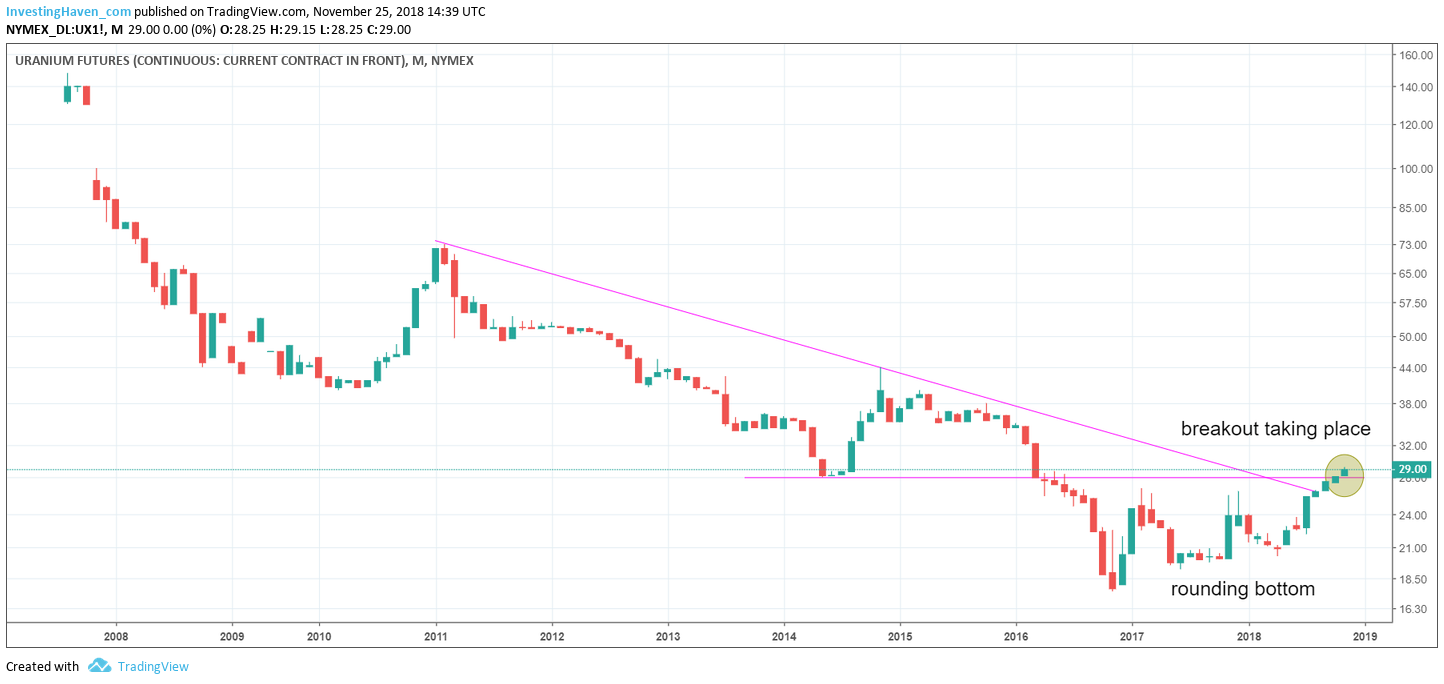
If we zoom in we see this rounding bottom on the 10 year chart. More importantly, there is a breakout in the making right now.
Interestingly, this is a double breakout. On the one hand there is a break above the previous lows (summer 2014) on horizontal support, on the other hand there is a break above this 7 year falling triangle.
This is a powerful signal. The monthly chart below must show at a minimum 3 more monthly closes above $28 in order to qualify as a confirmed breakout. This, obviously, if if were to happen, would be very bullish for our uranium stocks forecast 2019.
We believe that uranium’s spot price has room to rise to $40 in 2019 though it may happen gradually. One scenario is that it consolidates around current levels, and only pushes higher towards the end of 2019. Again, the intransparency in this market makes it hard to forecast the timing.
3 Top Uranium Stocks Forecast for 2019
As part of our uranium stocks forecast 2019 we look at the long term dominant trends in 3 leading uranium stocks. We have identified one stock per segment: large cap and producer, small cap, junior/explorer.
Each of our uranium stocks forecast 2019 forecast gets invalidated once uranium’s spot price goes below $28 for at least 3 consecutive months (monthly closes).
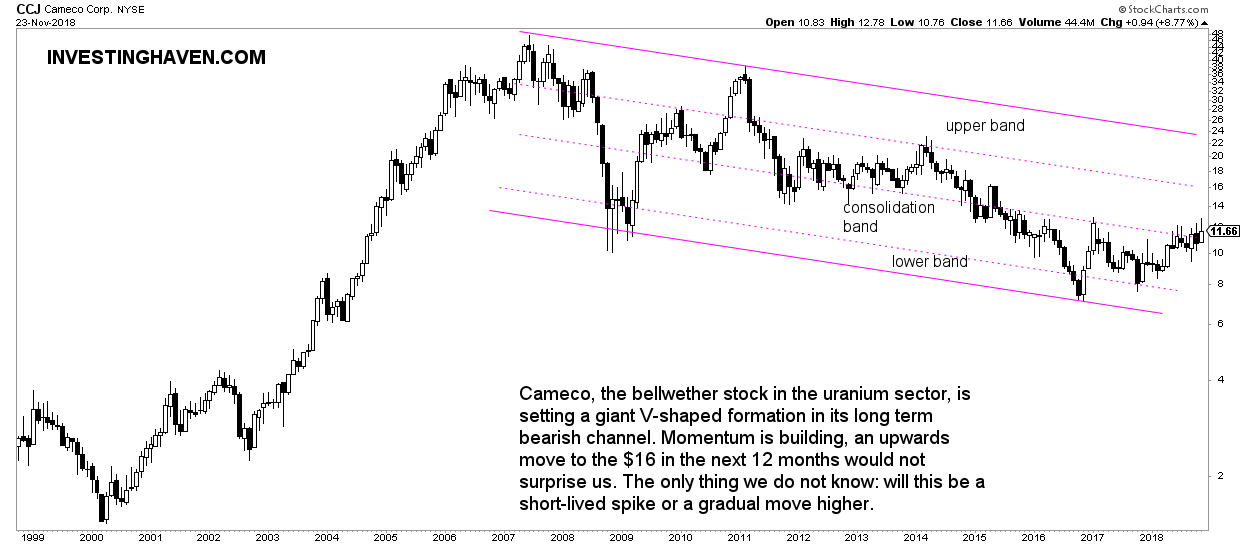
First, in the large cap, Cameco Corp (CCJ), the leading uranium stock globally.
We can for hours about its fundamentals but what matters ultimately is the uranium spot price as this will drive both revenues and earnings. Moreover, we are interested in the dominant trend on Cameco’s long term chart.
Cameco shows a beautiful rounding bottom, similar to the spot price of uranium. It is now moving from its ‘consolidation band’ to one band higher. We believe that, provided that uranium’s spot price continues to trade above $28, Cameco might test $16 in 2019. This is uranium stocks forecast 2019 specifically for Cameco.
Second, in the cap we have selected UEC: Uranium Energy Corp (UEC).
As explained in our Uranium Energy Corp Stock Forecast for 2018 the fundamentals of Uranium Energy Corp suggest that this company absolutely needs higher uranium prices to survive and become structurally bullish. This is why:
- UEC is not generating any revenue right now.
- There is a $3M loss per quarter.
- Between 1 and 3 million of new shares are created per quarter.
- At the end of April there was $12M cash on its balance with a burn rate of $3M per quarter. So by early 2019 there will not be any cash, at the current rate, unless there will be revenue between now and then or a capital raise.
This is what we wrote last year:
“The balance sheet of UEC shows that it has dramatically lowered its sales efforts. In the meantime they sit on a big stock of uranium.”
UEC is still exploring several projects across the globe. Some are close to production. So UEC really needs higher uranium prices in order to survive the coming 12 months until there is sufficient revenue by their uranium production properties.
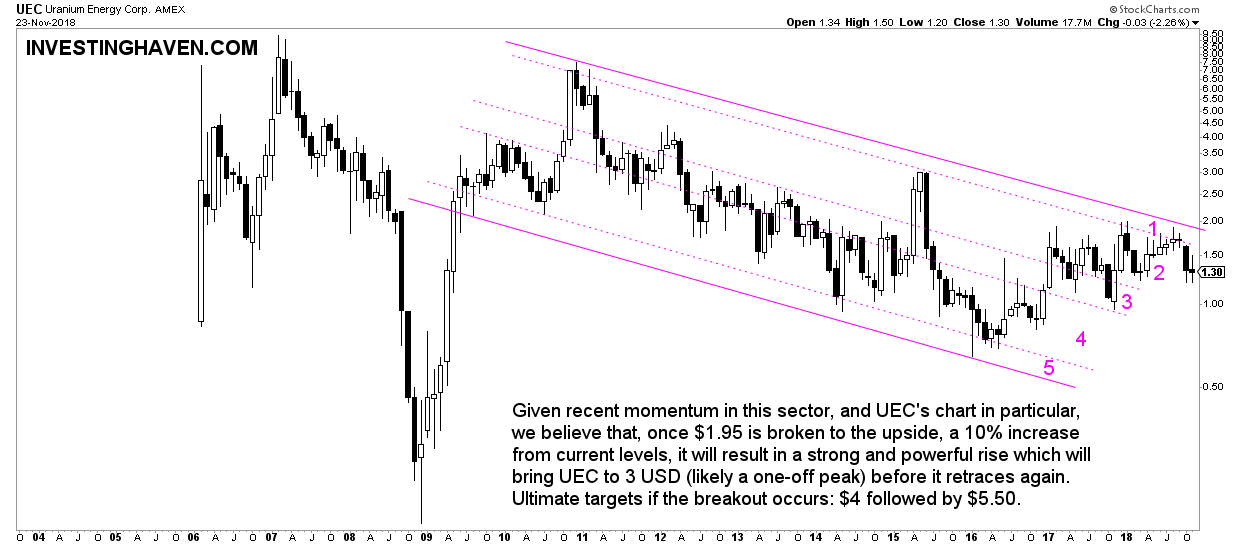
Its chart looks strong, even after the recent decline. It is clear that UEC is a leveraged play on the uranium spot price.
If and once UEC breaks out of its falling channel we may see a quick rise to $4. This may or may not happen in 2019, it will all depend on how uranium’s spot price develops.
Last but not least Fission Uranium is an explorer with one project. This is a very high risk play.
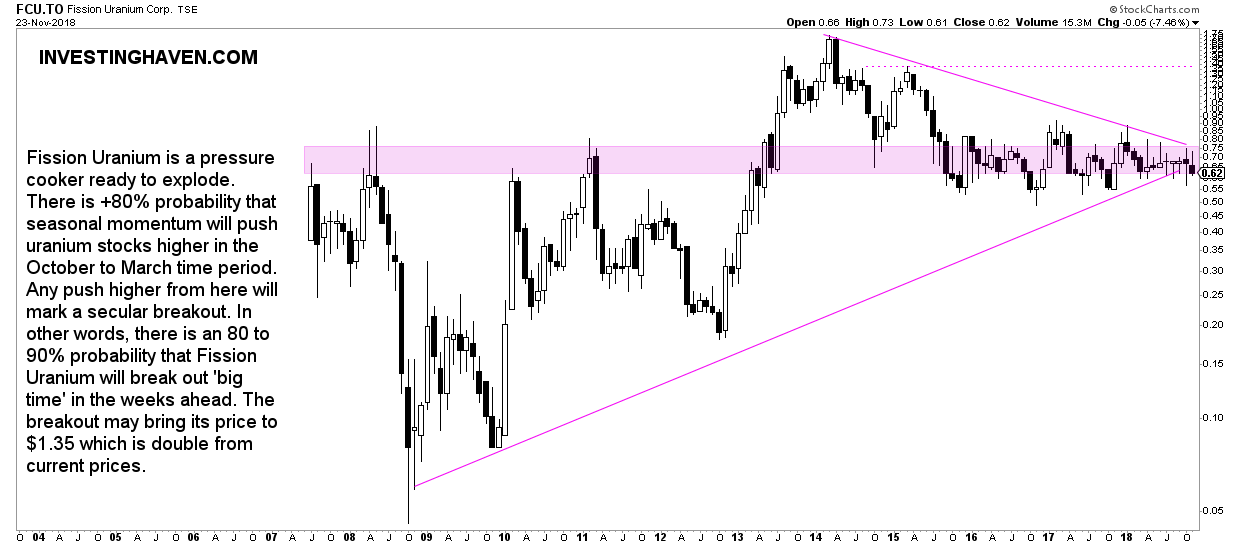
As per our Fission Uranium Stock Forecast for 2019 fundamentals have a bullish bias. As seasonal effects support higher prices in the time ahead it is likely to push Fission Uranium higher, outside of its giant triangle pattern. The bullish aspect of this is that a 20 pct increase, which is nothing for a highly volatile stock in a sector like uranium will create a breakout. That’s why we tend to use the analogy of a pressure cooker.
“If this breakout takes place still this year there is plenty of time to move higher in this November-February timeframe. This will likely bring Fission Uranium to the $1.35 area in the first month(s) of 2019.”
An Uranium Stocks Forecast for 2019: Seasonality
Last but not least, according to our seasonality chart (for which we have chosen UEC as the barometer) it is clear that the months November till February is the most profitable period of the year for uranium stocks).
In other words, if uranium really breaks out it is likely going to happen until February. Uranium stocks will do very well.
If not, though, the real breakout might take place at the end of 2019.
Update on January 6th, 2019: uranium price testing support, is this a confirmed breakout?
As this uranium stock forecast was written in October we want to update readers on our forecast as 2019 kicks off.
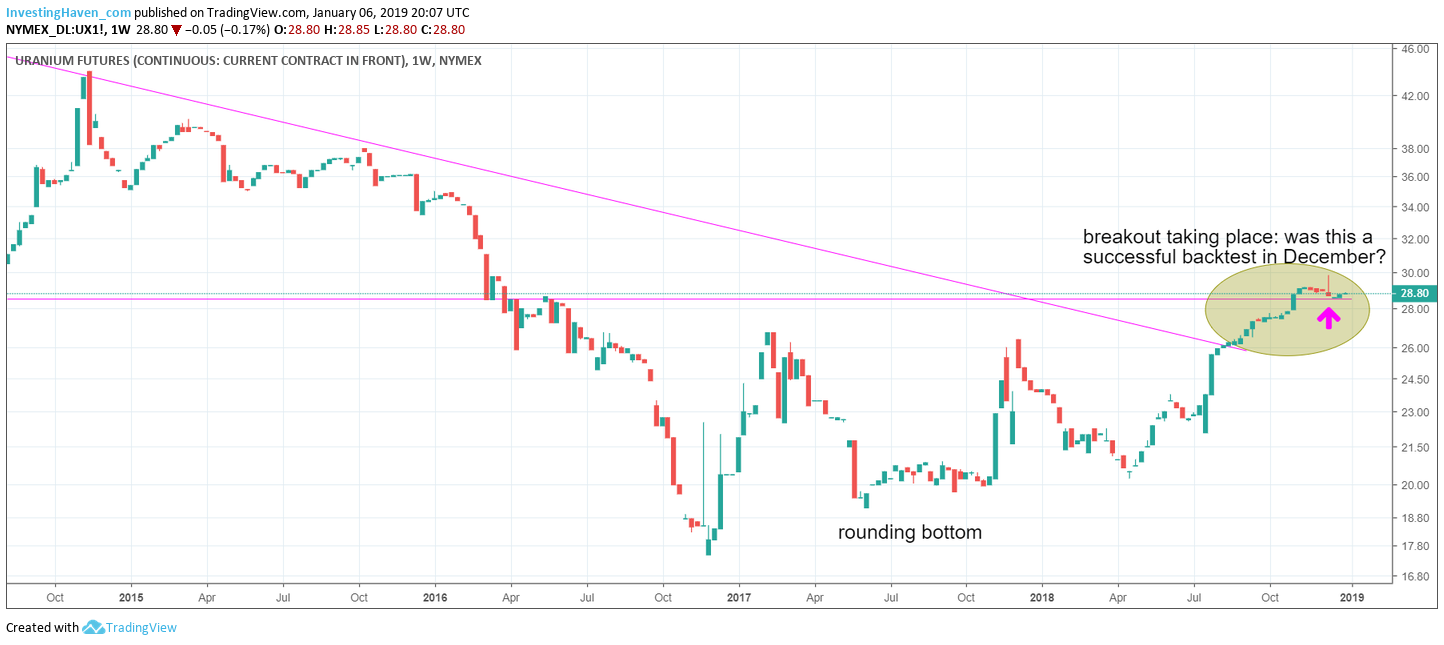
By far the most important indicator is the spot price of uranium. As seen on below chart there may be a very bullish development underway in the uranium: a successful backtest of the recent breakout. This has to be confirmed though, so we recommend not to become too excited as of yet.
What if the $28.50 level in uranium spot price holds, and the gap to $35 to $38 will be closed? This would be wildly bullish for uranium stocks.
What if the $28.50 level in uranium breaks down? This would be bearish, and uranium spot would be eyeing $24.50 a few months later.

