Investing Haven
No Result
View All Result
Gold Silver Investing >>
CRYPTO INVESTING >>
  • 2025 Forecasts
    • 10 market predictions
    • Dow Jones forecast
    • S&P 500 forecast 2025
    • Nasdaq prediction 2025
    • Best altcoins to buy
    • Best crypto to buy now
    • Which crypto will explode
    • 15 crypto forecasts 2025
    • Which precious metal to buy
  • Silver
    • Silver prediction 2025 – 2030
    • Will silver exceed $30?
    • When will silver hit $50?
    • Can silver hit $100?
    • Silver shortage
    • 50-year silver chart
    • Silver bullish reversal
    • Silver seasonality charts
    • How to invest in silver
  • Gold
    • Gold prediction 2025 – 2030
    • Will gold set new ATH?
    • Will gold hit $3,000?
    • Can gold hit $10,000?
    • Gold chart 10 years
    • Gold chart 50 years
    • Gold chart 100 years
    • Gold silver ratio
    • Gold seasonality charts
  • Commodities
    • Coffee forecasts
    • Sugar forecasts
    • Nickel forecasts
    • Lithium investing
  • Crypto forecasts
    • BTC prediction 2025 – 2030
    • ETH prediction 2025 – 2030
    • SOL prediction 2025 – 2030
    • XRP prediction 2025 – 2030
    • XLM prediction 2025 – 2030
    • BNB prediction 2025 – 2030
    • ADA prediction 2025 – 2030
    • AVAX prediction 2025 – 2030
    • KAS prediction 2025 – 2030
    • NEAR prediction 2025 – 2030
    • BCH prediction 2025 – 2030
    • LINK prediction 2025 – 2030
    • DOT prediction 2025 – 2030
    • SUI prediction 2025 – 2030
    • ICP prediction 2025 – 2030
    • LTC prediction 2025 – 2026
    • STX prediction 2025 – 2030
    • DOGE prediction 2025 – 2030
    • SHIB prediction 2025 – 2030
    • PEPE prediction 2025 – 2030
    • FLOKI prediction 2025 – 2030
    • WIF prediction 2025 – 2030
    • ONDO prediction 2025 – 2030
  • News
    • Crypto news
    • Commodities
  • Login
Investing Haven
No Result
View All Result

Home » Silver » Is The Silver Market Breakout Confirmed?

Is The Silver Market Breakout Confirmed?

The silver market breakout happened on April 2nd, 2024. Since then, silver moved higher, with some short-lived breaks.

Taki T. by Taki T.
November 2, 2024
in Silver
silver chart trendline
2.3k
VIEWS
Share on FacebookShare on Twitter

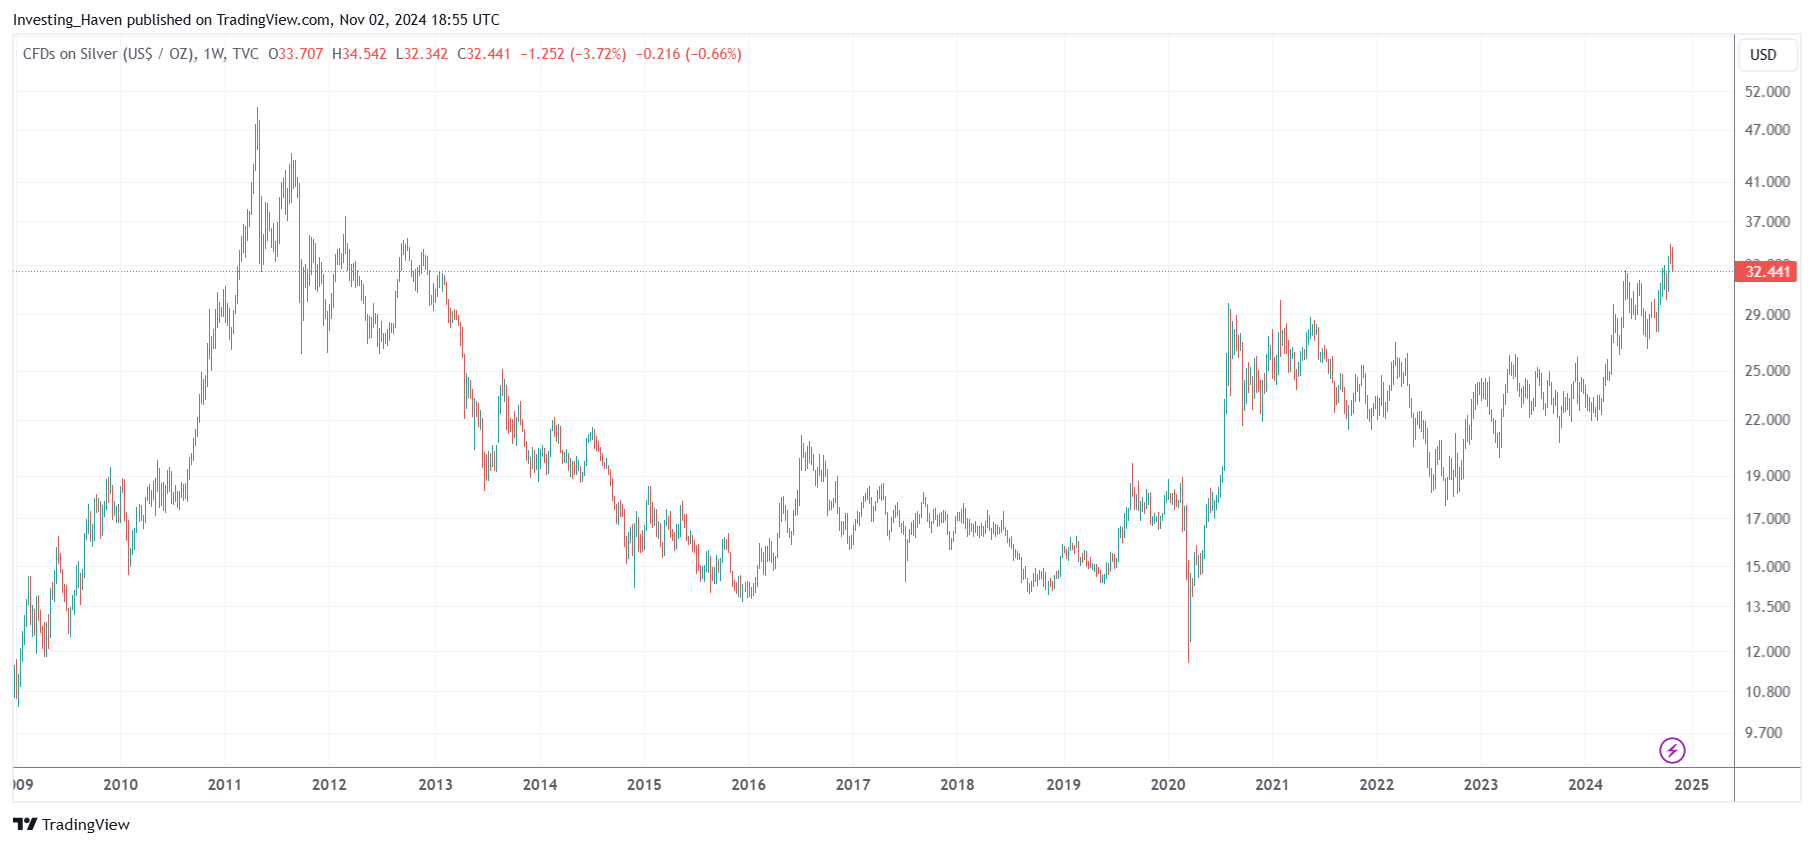
The secular silver market breakout is now confirmed. The silver secular uptrend is in progress. Silver is printing a series of breakouts.

Related – When Exactly Will The Price Of Silver Start A Rally To $50?

It took silver a long time characterized by a really long consolidation which lasted more than 3 years (2021 – 2023). The breakout happened, even on the secular timeframes.

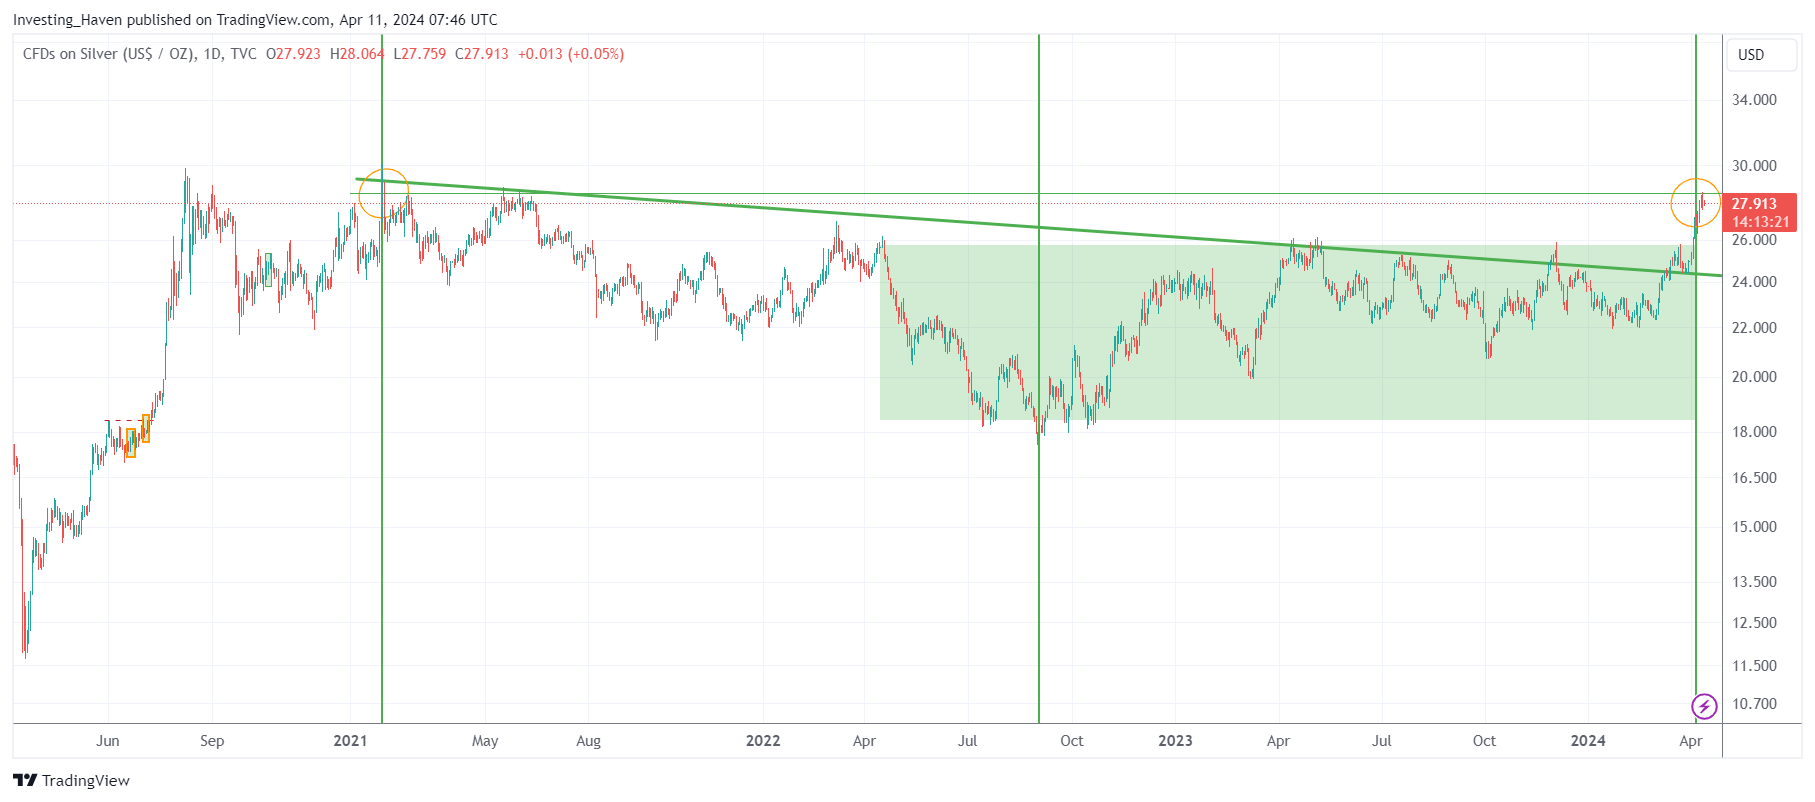
Silver completing a bullish basing pattern

In general, one of the most powerful chart structures is the bullish basing pattern.

In essence, a bullish basing pattern is a long consolidation in which key support levels are respected. The consolidation is orderly, it occurs after a big rise. Remember, the longer the consolidation, the higher the upside potential.

Silver’s basing pattern has all these characteristics:

  • A big rise in the period June/July of 2020.
  • A long consolidation since August of 2020.
  • Key support levels around 20 USD/oz were respected.
  • The only ‘violation’ of key support occurred late summer 2022. As seen on the chart, this ‘violation’ morphed into a series of 3 bullish micro-patterns, right below 20 USD/oz.

In sum, the daily silver price chart has a very bullish looking.

November 2nd – The long term silver chart is impressive, stunning, powerful!

silver price long term bullish reversal
Silver price long term bullish reversal

Silver market breakout: April 2nd, 2024, a day for history books

Below is the same silver daily price chart, with our annotations. Readers should pay attention to the timeline with the green horizontal lines confirming a perfect symmetric setup of 2x 414 days on the time axis:

  1. The falling silver trendline since the 2021 top – as seen, silver is now for several consecutive days above the falling trendline – in a way, this is a breakout.
  2. The bullish reversal structure since April of 2022 – as seen, the reversal structure, the green shaded area, is now complete.

If we combine both ‘chart events’, we can conclude that silver has broken out of its multi-year downtrend. In other words, this is a breakout on medium-term timeframes. This silver breakout is confirmed as there are 8 daily candles above the breakout level.

Further to the conclusion from the previous chart in the previous section, we can now say that the silver chart confirmed an epic breakout.

September 4th, 2024 – The chart below shows the point of breakout, early April 2024.

silver market breakout
Silver breakout visualized on April 2nd, 2024, which was exactly 2x 414 days after its secondary top at $28.80

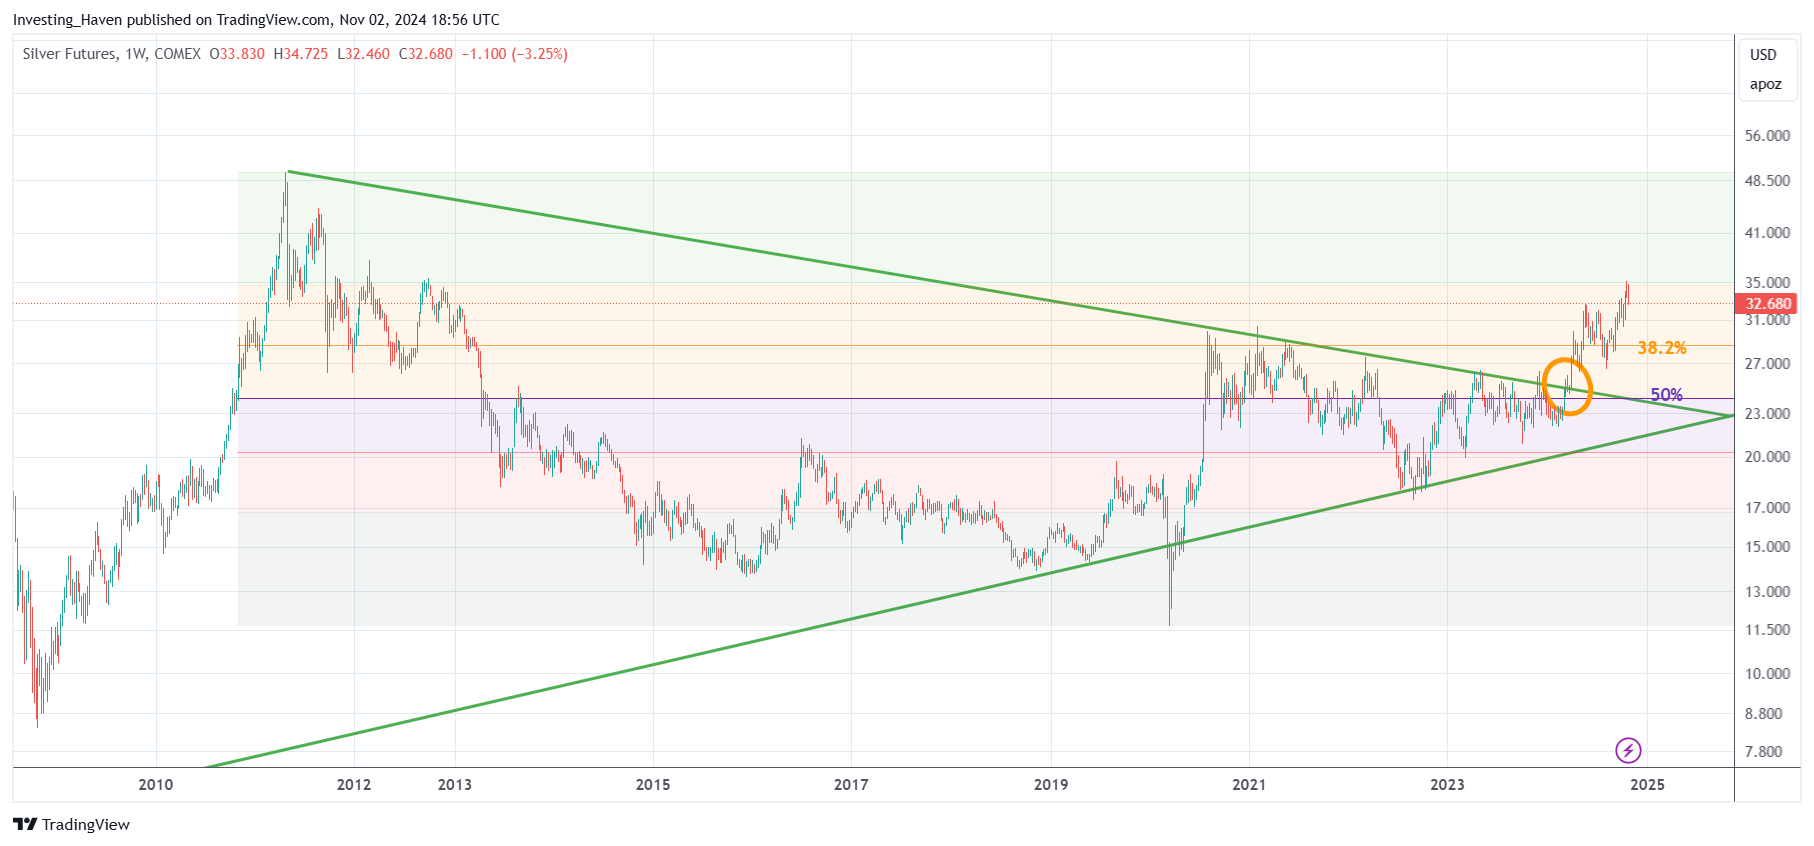
The silver market breakout on its secular timeframe

Now, let’s turn to silver’s secular timeframe. We use the weekly silver price chart to analyze secular trends including a possible secular silver market breakout.

The annotations on this chart are important. The Fibonacci retracement level that truly matters is the 50% retracement level which comes in around 24.50 USD/oz.

As seen, silver moved above the falling trendline which connects the 2011 peak with the highs since 2020. Moreover, silver is now above its 50% retracement level. What is truly unique is that silver is now above both patterns on its secular chart – this has not happened before.

Moreover, and this might be the proverbial elephant in the room, the triangle visible on silver’s secular breakout is nothing short of beautiful, hence powerful. Remember, the longer a chart pattern, the stronger. This means that the power unleashed by the silver market breakout is tremendous.

November 2nd – Did the silver breakout stall? Not really, silver has been hesitating around its long term 38.2% Fibonacci level, a price point nobody talks about because it’s a long term retracement level (social media and financial media are so short term oriented). Moreover, as silver seasonality is favorable, we believe each hesitation is a temporary consolidation on the way higher. Moreover, an epic silver shortage is brewing, which is the catalyst for silver to move to ATH in 2025.

The silver price breakout happened on April 2nd, 2024
The silver price breakout happened on April 2nd, 2024 – quite some upside expected in 2025

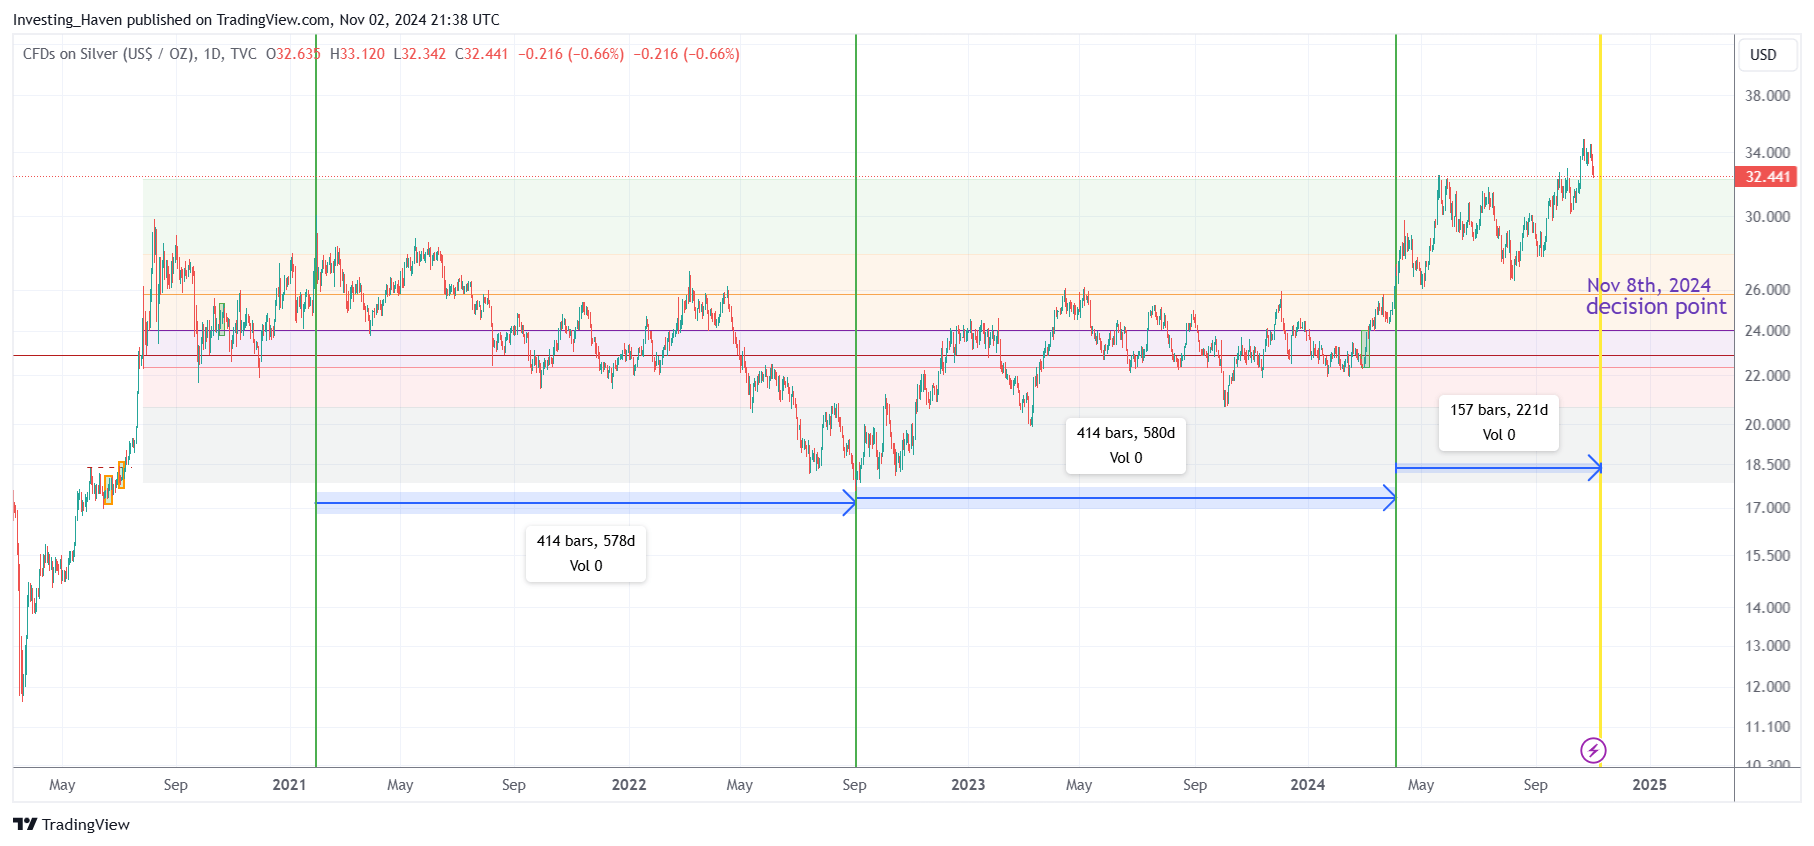
Silver market breakout – status in November 2024

At the time of updating this article, in November 2024, it is clear how powerful the bullish reversal is on the silver price chart.

The silver chart, with timeline annotations combined with price annotations, highlights a few points:

  1. A very bullish chart pattern: it’s a W-reversal, pure, powerful.
  2. The symmetric nature on the timeline – twice 414 days for the bullish reversal to complete.
  3. Another 157 days, which coincides with the 38.2% Fibonacci point on the timeline of the silver chart, leading to Nov 8th, 2024, a silver market breakout back test.

The silver chart, emphasizing the silver breakout, is a pure beauty!

November 2nd – This chart and section was added on Nov 2nd, 2024.

silver bullish breakout
Silver market bullish breakout – November 2024

Conclusion – Silver breakout is solidified

With each passing month, the silver breakout is becoming stronger:

  • The breakout point on all timeframes is the same – 26 USD/oz.
  • Silver’s breakout on the daily timeframe was confirmed once it decisively moved above 26.20 USD/oz on a 5 to 8 day closing basis..
  • Silver’s secular breakout on its weekly chart was confirmed once it decisively moved above 26 USD/oz on a 5 to 8 week closing basis.

Silver’s chart setup has everything to qualify as a confirmed breakout.

November 2nd – We are confident that silver breakout is for real! We agree with this silver breakout scenario.

Anecdotal evidence: more upside potential in silver

Fun fact – you would have expected Wall Street Silver to be in overdrive with the ongoing silver breakout but nothing is further from the truth. If this would mean that the silver breakout is not being recognized and respected, it would be the ultimate confirmation that silver has much more upside potential, from an anecdotal perspective. That’s because Wall Street Silver’s success coincided with a major top in the silver market in 2021.


If you like our silver analysis, we invite you to follow our premium gold & silver alerts >>


10-YEAR ANNIVERSARY OFFER: InvestingHaven.com celebrates 10 years. Temporarily, you can enjoy a discount on our premium gold/silver and crypto reports. Or you can become a VIP member. Go to our anniversary deals >>
Receive our weekly newsletter.

premium service SP-500 premium service trade alerts premium service crypto teaser 

No related posts.

Tags: SILVER
Taki T.

Taki T.

Taki is a chart analyst who is passionate about unlocking unique insights out the chart. While the vast majority of analysts remain focused on price analysis, Taki starts with timeline analysis and adds price analysis to this. In doing so, he developed a unique methodology to find opportunities in financial markets, across assets and markets.

Connect with InvestingHaven

Receive top notch forecasts for free.

*We hate spam as you do.

Site Navigation

  • RSS Feed
  • About us
  • Advertising
  • Sponsored Content Policy
  • Mission 2026
  • Sitemap
  • Privacy & Disclaimer
  • Terms of Service
  • Contact Us
investing haven logo

Precious metals market analysis including gold and silver price predictions. Crypto market analysis including highly accurate BTC ETH SOL XRP forecasts.

Copyright © 2025 InvestingHaven

Login to your account below

Forgotten Password?

Fill the forms bellow to register

All fields are required. Log In

Retrieve your password

Please enter your username or email address to reset your password.

Log In

Receive top notch forecasts for free.

*We hate spam as you do.

No Result
View All Result
  • News
  • 2025 Forecasts
    • 10 market predictions
    • Dow Jones forecast 2025
    • S&P 500 forecast 2025
    • Nasdaq prediction 2025
    • Best crypto to buy now
    • Which crypto will explode
    • Best altcoins to buy
    • 15 crypto forecasts 2025
    • Which precious metal to buy
  • Silver articles
    • Silver prediction 2025 – 2030
    • Will silver exceed $30?
    • When will silver hit $50?
    • Can silver hit $100?
    • Silver shortage
    • 50-year silver chart
    • Silver bullish reversal
    • Silver seasonality charts
    • How to invest in silver
  • Gold
    • Gold prediction 2025 – 2030
    • Will gold set new ATH?
    • Will gold hit $3,000?
    • Can gold hit $10,000?
    • Gold chart 10 years
    • Gold chart 50 years
    • Gold chart 100 years
    • Gold silver ratio
    • Gold seasonality charts
  • Commodities
    • Sugar forecasts
    • Coffee forecasts
    • Nickel forecasts
    • Lithium investing
  • Crypto news
  • Crypto forecasts
    • BTC prediction 2025 – 2030
    • ETH prediction 2025 – 2030
    • SOL prediction 2025 – 2030
    • XRP prediction 2025 – 2030
    • XLM prediction 2025 – 2030
    • BNB prediction 2025 – 2030
    • ADA prediction 2025 – 2030
    • AVAX prediction 2025 – 2030
    • KAS prediction 2025 – 2030
    • NEAR prediction 2025 – 2030
    • BCH prediction 2025 – 2030
    • LINK prediction 2025 – 2030
    • DOT prediction 2025 – 2030
    • SUI prediction 2025 – 2030
    • ICP prediction 2025 – 2030
    • LTC prediction 2025 – 2026
    • STX prediction 2025 – 2030
    • DOGE prediction 2025 – 2030
    • SHIB prediction 2025 – 2030
    • PEPE prediction 2025 – 2030
    • FLOKI prediction 2025 – 2030
    • WIF prediction 2025 – 2030
    • ONDO prediction 2025 – 2030
  • Premium Crypto Alerts
  • Premium services

Copyright © 2025 InvestingHaven