Investing Haven
No Result
View All Result
Gold Silver Investing >>
CRYPTO INVESTING >>
  • 2025 Forecasts
    • 10 market predictions
    • Dow Jones forecast
    • S&P 500 forecast 2025
    • Nasdaq prediction 2025
    • Best altcoins to buy
    • Best crypto to buy now
    • Which crypto will explode
    • 15 crypto forecasts 2025
    • Which precious metal to buy
  • Silver
    • Silver prediction 2025 – 2030
    • Will silver exceed $30?
    • When will silver hit $50?
    • Can silver hit $100?
    • Silver shortage
    • 50-year silver chart
    • Silver bullish reversal
    • Silver seasonality charts
    • How to invest in silver
  • Gold
    • Gold prediction 2025 – 2030
    • Will gold set new ATH?
    • Will gold hit $3,000?
    • Can gold hit $10,000?
    • Gold chart 10 years
    • Gold chart 50 years
    • Gold chart 100 years
    • Gold silver ratio
    • Gold seasonality charts
  • Commodities
    • Coffee forecasts
    • Sugar forecasts
    • Nickel forecasts
    • Lithium investing
  • Crypto forecasts
    • BTC prediction 2025 – 2030
    • ETH prediction 2025 – 2030
    • SOL prediction 2025 – 2030
    • XRP prediction 2025 – 2030
    • XLM prediction 2025 – 2030
    • BNB prediction 2025 – 2030
    • ADA prediction 2025 – 2030
    • AVAX prediction 2025 – 2030
    • KAS prediction 2025 – 2030
    • NEAR prediction 2025 – 2030
    • BCH prediction 2025 – 2030
    • LINK prediction 2025 – 2030
    • DOT prediction 2025 – 2030
    • SUI prediction 2025 – 2030
    • ICP prediction 2025 – 2030
    • LTC prediction 2025 – 2026
    • STX prediction 2025 – 2030
    • DOGE prediction 2025 – 2030
    • SHIB prediction 2025 – 2030
    • PEPE prediction 2025 – 2030
    • FLOKI prediction 2025 – 2030
    • WIF prediction 2025 – 2030
    • ONDO prediction 2025 – 2030
  • News
    • Crypto news
    • Commodities
  • Login
Investing Haven
No Result
View All Result

Home » Breakout / Breakdown » Spectacular Gold And Silver Price Charts Pointing To A Decisive Outcome

Spectacular Gold And Silver Price Charts Pointing To A Decisive Outcome

Taki T. by Taki T.
November 28, 2023
in Breakout / Breakdown
fascinating charts
2k
VIEWS
Share on FacebookShare on Twitter

The gold (GOLD) and silver (SILVER) market have reached a climx. As said recently, this is THE most important week of the year for precious metals as the trend for the 2nd half of the year will start … now. That is not because we hope so, that is because all precious metals charts are suggesting this.

First, as said many times before, the gold price chart is leading during a trend change. Precious metals are still in a long term bear market, one that started in 2011. Notwithstanding some temporary excitement, like in the first months of last year, the bear market continues up until the point the long term trend changes. Such a trend change will be triggered by the gold price. That is why we provided so much coverage on gold’s price chart in recent months.

Since April of this year, the gold market went from false breakdown to false breakout. The precious metals market has confused bulls and bears in a way never seen before.

Our bias remained bearish, as we spotted signals like the one we wrote in Another Bearish Sign For Gold. Early July, it seemed to be official: Gold Price Breaks Down.

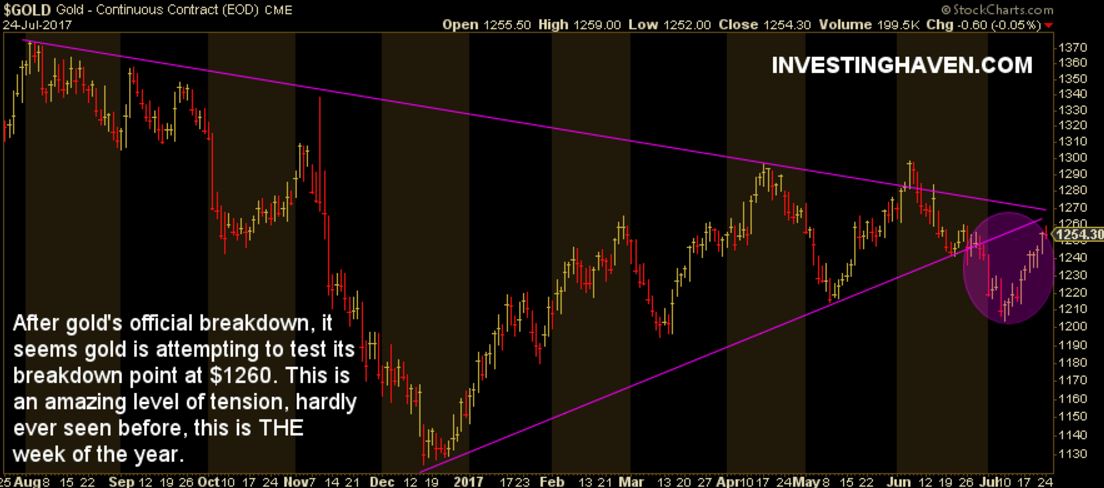
What happened since then is another incredible story: gold came up to test its breakdown level as shown on the first chart. The $1260 to $1270 level is THE most important price level for gold. If gold is unable to break above that level we will see much lower gold prices in the months ahead, and, ultimately, our Gold Price Forecast For 2017 will materialize.

However, if gold goes higher from here, it would be strongly bullish for the short term. The real trend change from bear to bull market will only take place once above $1325.

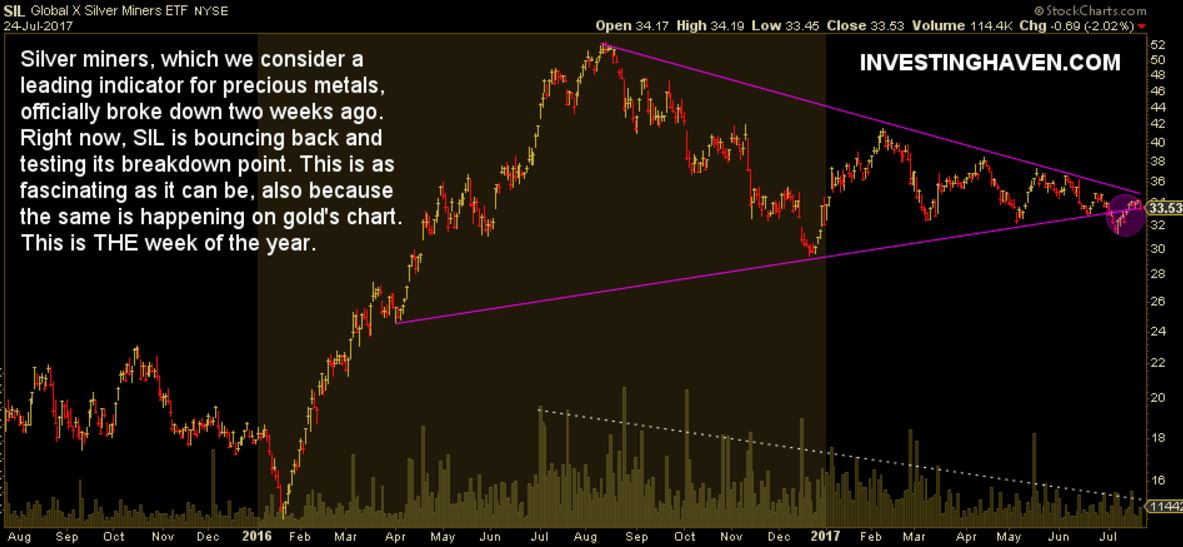
The other leading indicator in the precious metals market are silver miners, SIL ETF (SIL). We wrote extensively in recent months how accurate SIL has been because it moved in an incredibly accurate pattern. Last week, we wrote Silver Market: Tension Rises, THE Most Decisive Week Of The Year Coming. We still feel that the coming days will be decisive for gold and silver just because SIL confirms what the gold price chart suggests.

These gold and silver charts are truly fascinating. It is no understatement that the gold and silver market are spectacular given the price action in recent weeks and months.

Let is be clear that InvestingHaven’s research team is as open-minded as it can be. We are no perma-bears nor perma-bulls; we just read and interpret markets.

The last time we appeared on Marketwatch with our commentary on the silver market we said that, if silver would go lower from here, it would set up for a once-in-a-decade buy opportunity. That is what we are interested in: making profits in a low risk way. This is what MarketWatch wrote based on our market commentary:

Analysts at Investing Haven told MarketWatch back in late April that silver prices likely peaked for the year at $18.514 an ounce on April 17—and so far, it has. “We are bearish for 2017,” he said recently.

“But essentially, we see a once-in-a-decade opportunity in the gold and silver market,” InvestingHaven said. “2016 was great in the first months but we believe that, after the ongoing selloff in precious metals, 2017 will be setting up for a long-term bottom and, hence, a great buying opportunity.”

If gold and silver decline from here we target taking long positions towards the end of the year, which is typically the end of a bearish period and start of a bullish period, from an annual perspective.

10-YEAR ANNIVERSARY OFFER: InvestingHaven.com celebrates 10 years. Temporarily, you can enjoy a discount on our premium gold/silver and crypto reports. Or you can become a VIP member. Go to our anniversary deals >>
Receive our weekly newsletter.

premium service SP-500 premium service trade alerts premium service crypto teaser 

Related posts:

  1. Is Gold a Good Investment Right Now? Here’s What You Need to Know in 2025
  2. Gold Watch Today: What is The Gold Price Outlook This Week – Should You Buy or Sell?
  3. Gold Hits New Record Around $3,135 Amid Rising Trade Tensions
Tags: GOLDSILVERSilver Miners SIL ETF
Taki T.

Taki T.

Taki is a chart analyst who is passionate about unlocking unique insights out the chart. While the vast majority of analysts remain focused on price analysis, Taki starts with timeline analysis and adds price analysis to this. In doing so, he developed a unique methodology to find opportunities in financial markets, across assets and markets.

Leave a Reply Cancel reply

Your email address will not be published. Required fields are marked *

Connect with InvestingHaven

Receive top notch forecasts for free.

*We hate spam as you do.

Site Navigation

  • RSS Feed
  • About us
  • Advertising
  • Sponsored Content Policy
  • Mission 2026
  • Sitemap
  • Privacy & Disclaimer
  • Terms of Service
  • Contact Us
investing haven logo

Precious metals market analysis including gold and silver price predictions. Crypto market analysis including highly accurate BTC ETH SOL XRP forecasts.

Copyright © 2025 InvestingHaven

Login to your account below

Forgotten Password?

Fill the forms bellow to register

All fields are required. Log In

Retrieve your password

Please enter your username or email address to reset your password.

Log In

Receive top notch forecasts for free.

*We hate spam as you do.

No Result
View All Result
  • News
  • 2025 Forecasts
    • 10 market predictions
    • Dow Jones forecast 2025
    • S&P 500 forecast 2025
    • Nasdaq prediction 2025
    • Best crypto to buy now
    • Which crypto will explode
    • Best altcoins to buy
    • 15 crypto forecasts 2025
    • Which precious metal to buy
  • Silver articles
    • Silver prediction 2025 – 2030
    • Will silver exceed $30?
    • When will silver hit $50?
    • Can silver hit $100?
    • Silver shortage
    • 50-year silver chart
    • Silver bullish reversal
    • Silver seasonality charts
    • How to invest in silver
  • Gold
    • Gold prediction 2025 – 2030
    • Will gold set new ATH?
    • Will gold hit $3,000?
    • Can gold hit $10,000?
    • Gold chart 10 years
    • Gold chart 50 years
    • Gold chart 100 years
    • Gold silver ratio
    • Gold seasonality charts
  • Commodities
    • Sugar forecasts
    • Coffee forecasts
    • Nickel forecasts
    • Lithium investing
  • Crypto news
  • Crypto forecasts
    • BTC prediction 2025 – 2030
    • ETH prediction 2025 – 2030
    • SOL prediction 2025 – 2030
    • XRP prediction 2025 – 2030
    • XLM prediction 2025 – 2030
    • BNB prediction 2025 – 2030
    • ADA prediction 2025 – 2030
    • AVAX prediction 2025 – 2030
    • KAS prediction 2025 – 2030
    • NEAR prediction 2025 – 2030
    • BCH prediction 2025 – 2030
    • LINK prediction 2025 – 2030
    • DOT prediction 2025 – 2030
    • SUI prediction 2025 – 2030
    • ICP prediction 2025 – 2030
    • LTC prediction 2025 – 2026
    • STX prediction 2025 – 2030
    • DOGE prediction 2025 – 2030
    • SHIB prediction 2025 – 2030
    • PEPE prediction 2025 – 2030
    • FLOKI prediction 2025 – 2030
    • WIF prediction 2025 – 2030
    • ONDO prediction 2025 – 2030
  • Premium Crypto Alerts
  • Premium services

Copyright © 2025 InvestingHaven