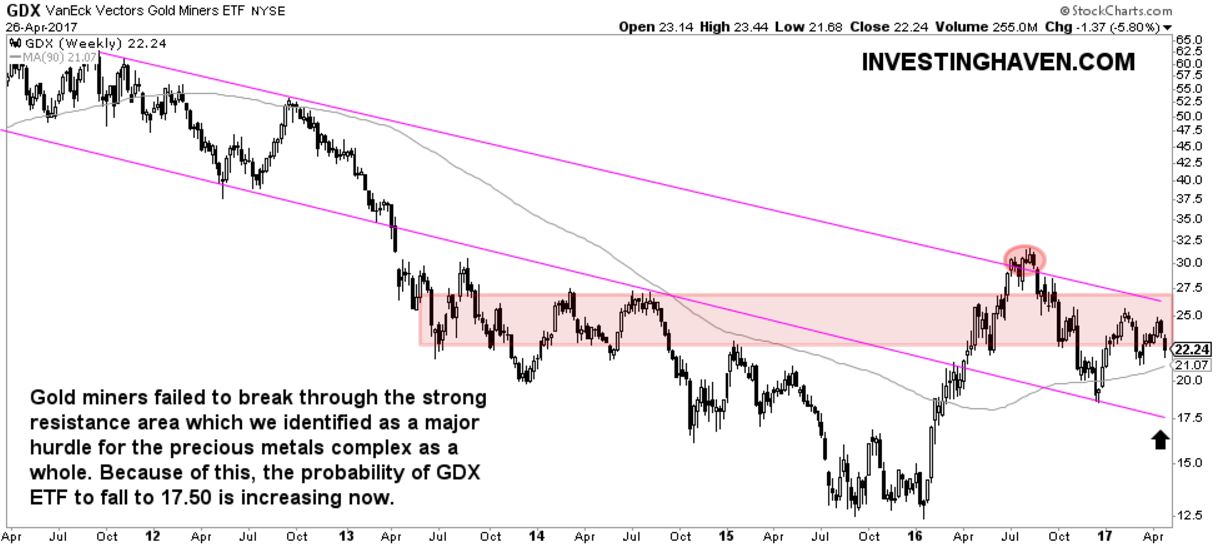
GDX ETF Looking Bearish, Ready To Fall 25 Pct
Gold has lost 1.5 pct since the close last week. The French election outcome supported risk assets, and traditional safe...
Read moreDetailsGold has lost 1.5 pct since the close last week. The French election outcome supported risk assets, and traditional safe...
Read moreDetailsU.S. stock markets are hitting new highs this week. The Nasdaq Composite index broke through the psychologically important level of...
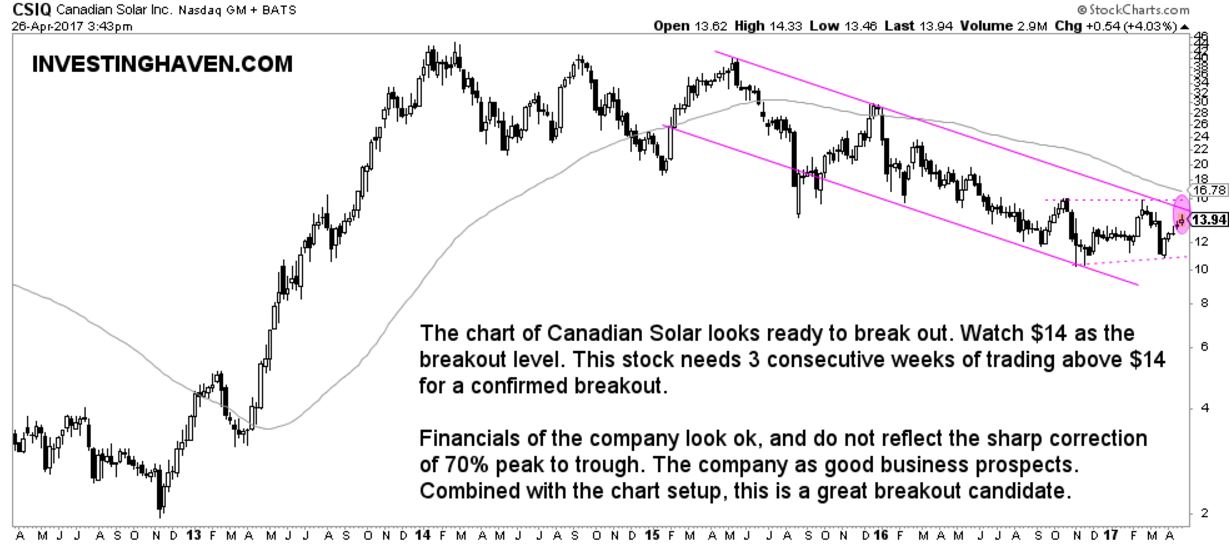
Read moreDetailsCanadian Solar is a small cap clean energy stock trading on the Nasdaq. It has a market cap of $800M....
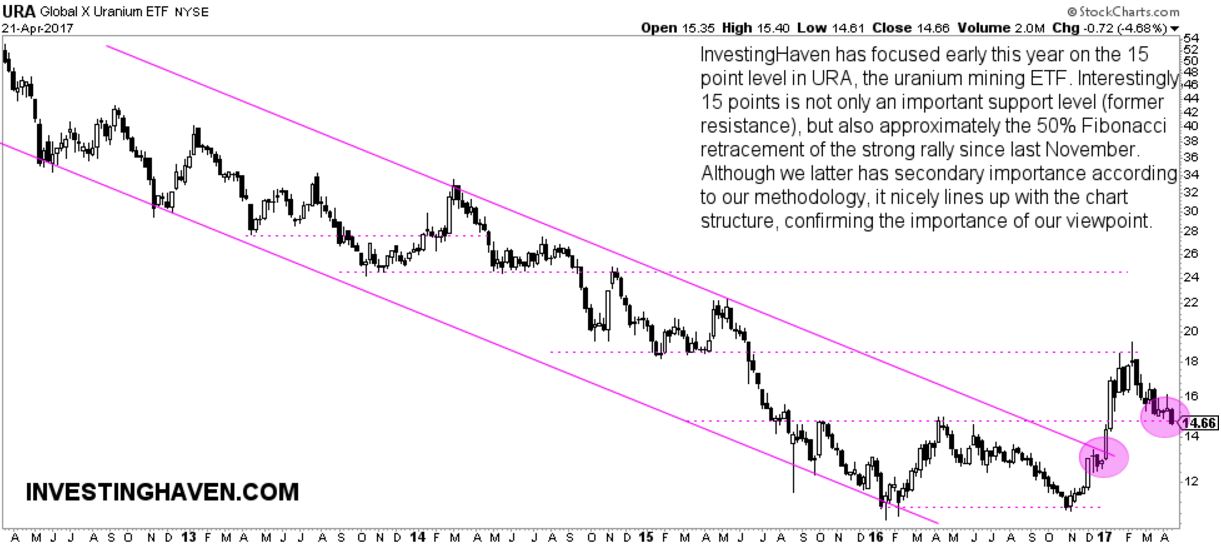
Read moreDetailsThe uranium space is creating suspension among investors. The most popular uranium mining ETF URA (URA) dropped 4.6 percent last week. With...
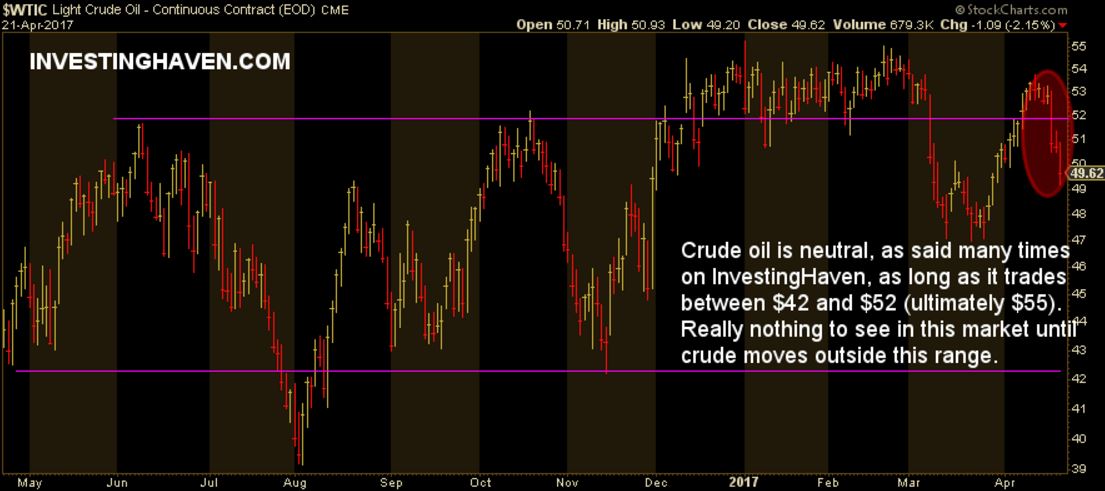
Read moreDetailsThe price of crude oil was weak last week. Crude oil dropped from $53.20 early this week to $49.62 on...
Read moreDetailsGold lost some value yesterday, as it fell from $1290 to $1270, but it recovered and stabilized at $1283 today....
Read moreDetailsStock market indexes gain around 1 percent today. Small cap index Russell 2000 is about close around 1382 points, a...
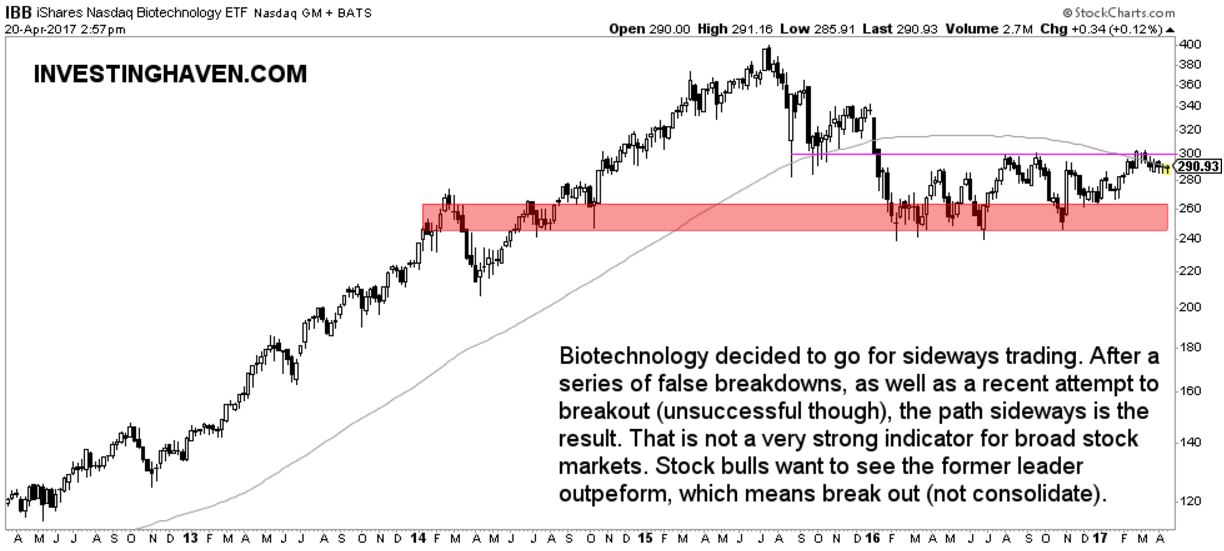
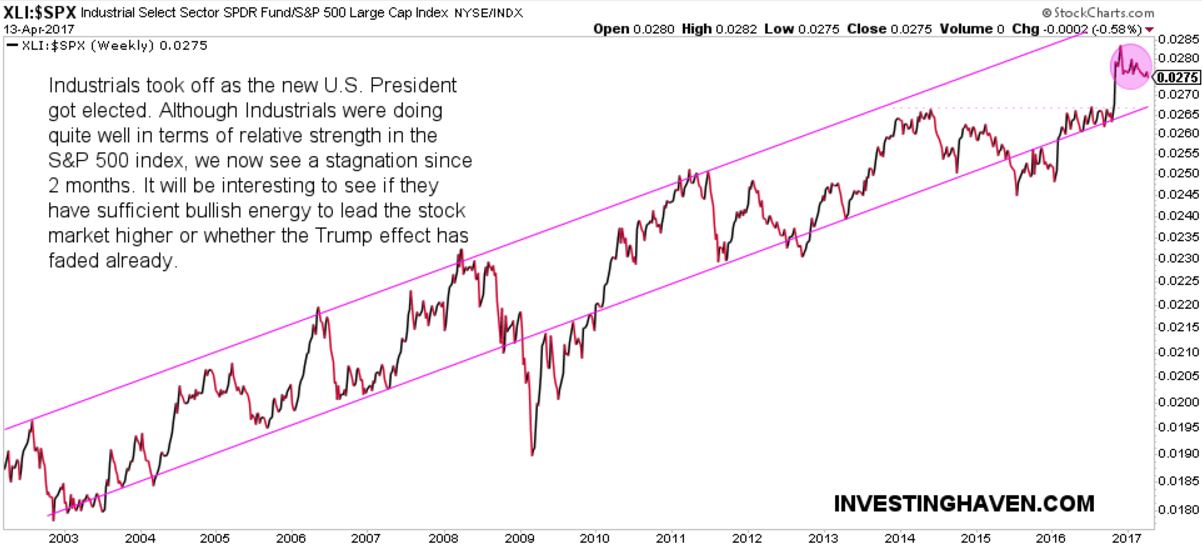
Read moreDetailsTrump pushed severeal markets higher in November which is what most tend to call the 'Trump effect'. We observed that...
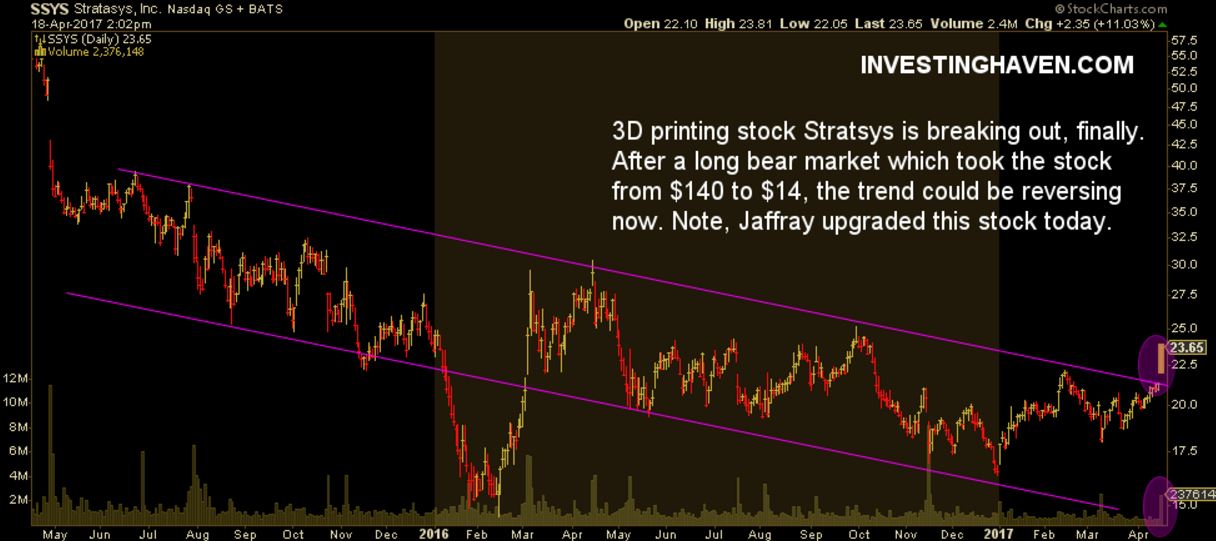
Read moreDetailsThe long awaited breakout in the 3D printing space is there. Today, Stratasys is leading the sector higher, with a...
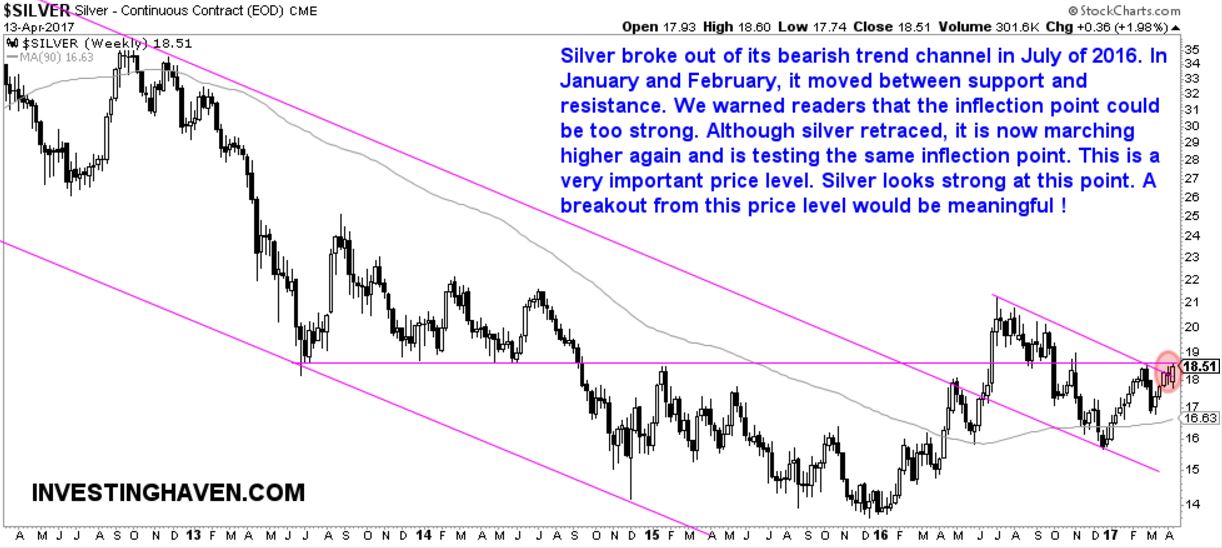
Read moreDetailsThe price of silver is as close as it can be to a major breakout point. Silver could start a...
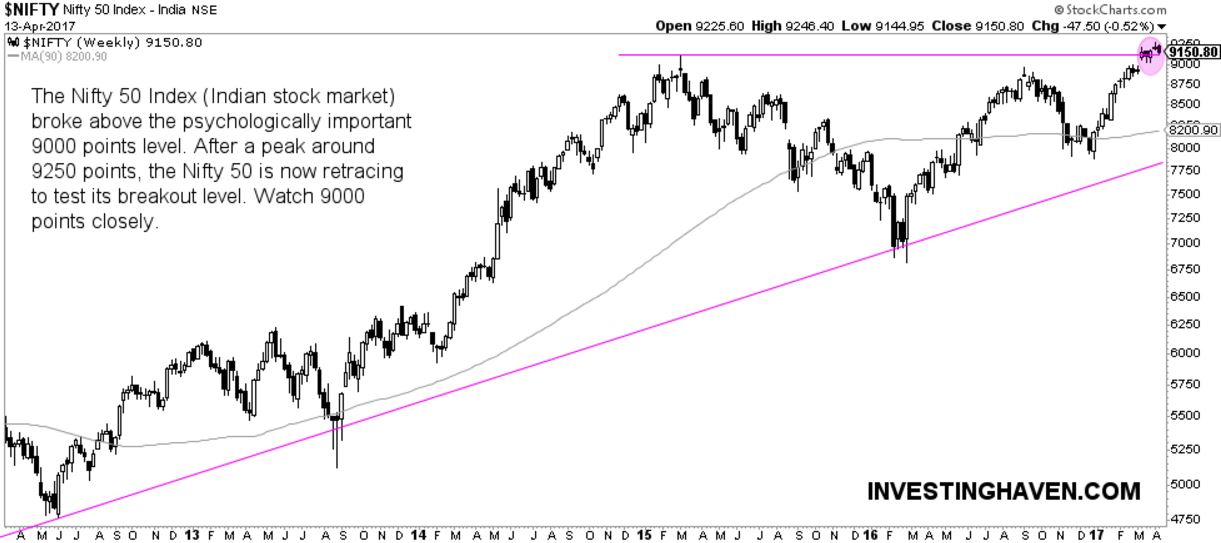
Read moreDetailsThe stock market in India is our favorite market, and we expressed that many times in the last 18 months....
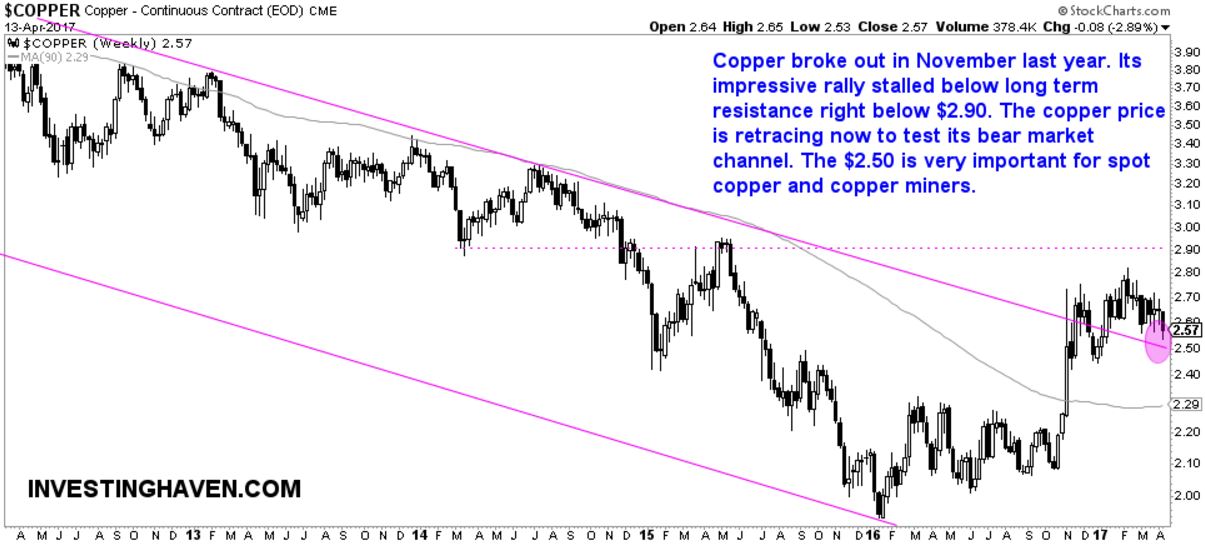
Read moreDetailsReaders vividly remember how hot the copper market was just 2 months ago. That is when we wrote that copper's chart...
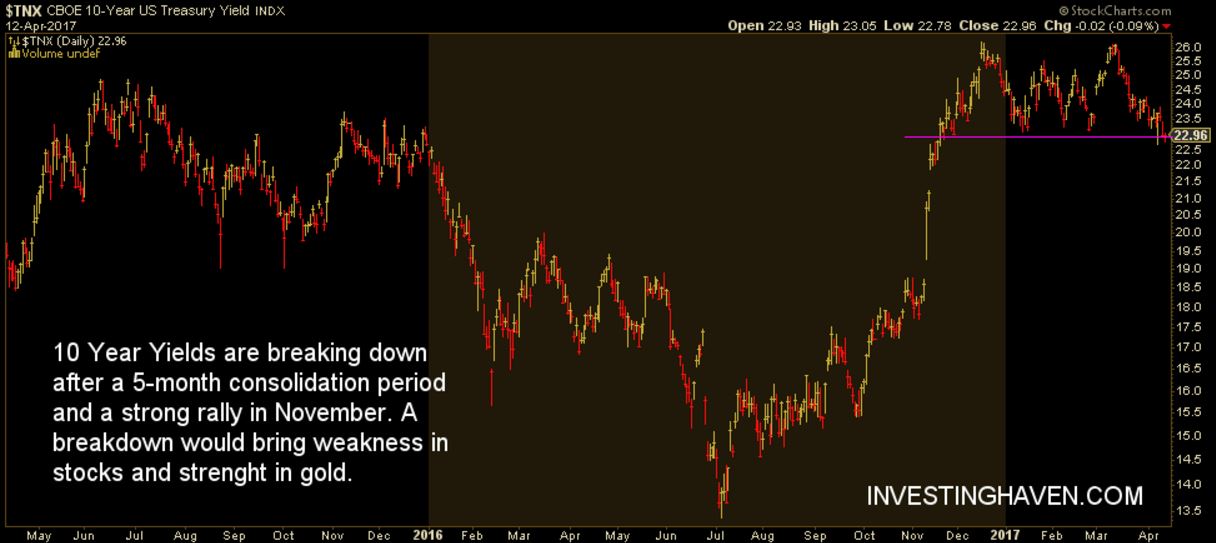
Read moreDetailsWe consider 10-year yields as a leading indicator for both stock markets and bond markets because it is a risk...
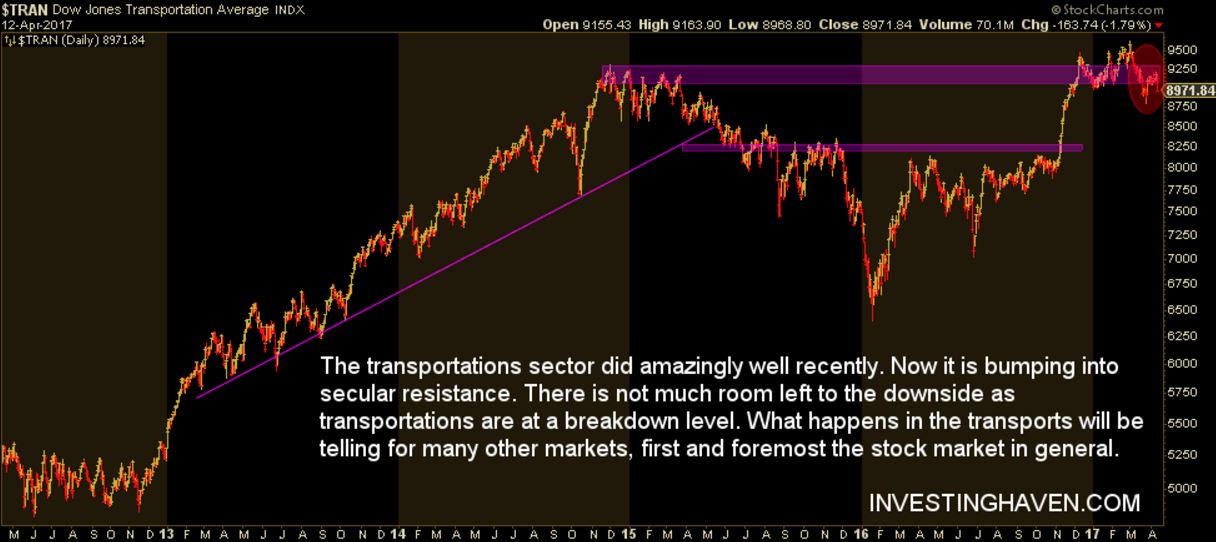
Read moreDetailsWe warne readers a while back to closely watch 5 leading markets which were at major inflection points, one of them...
Read moreDetails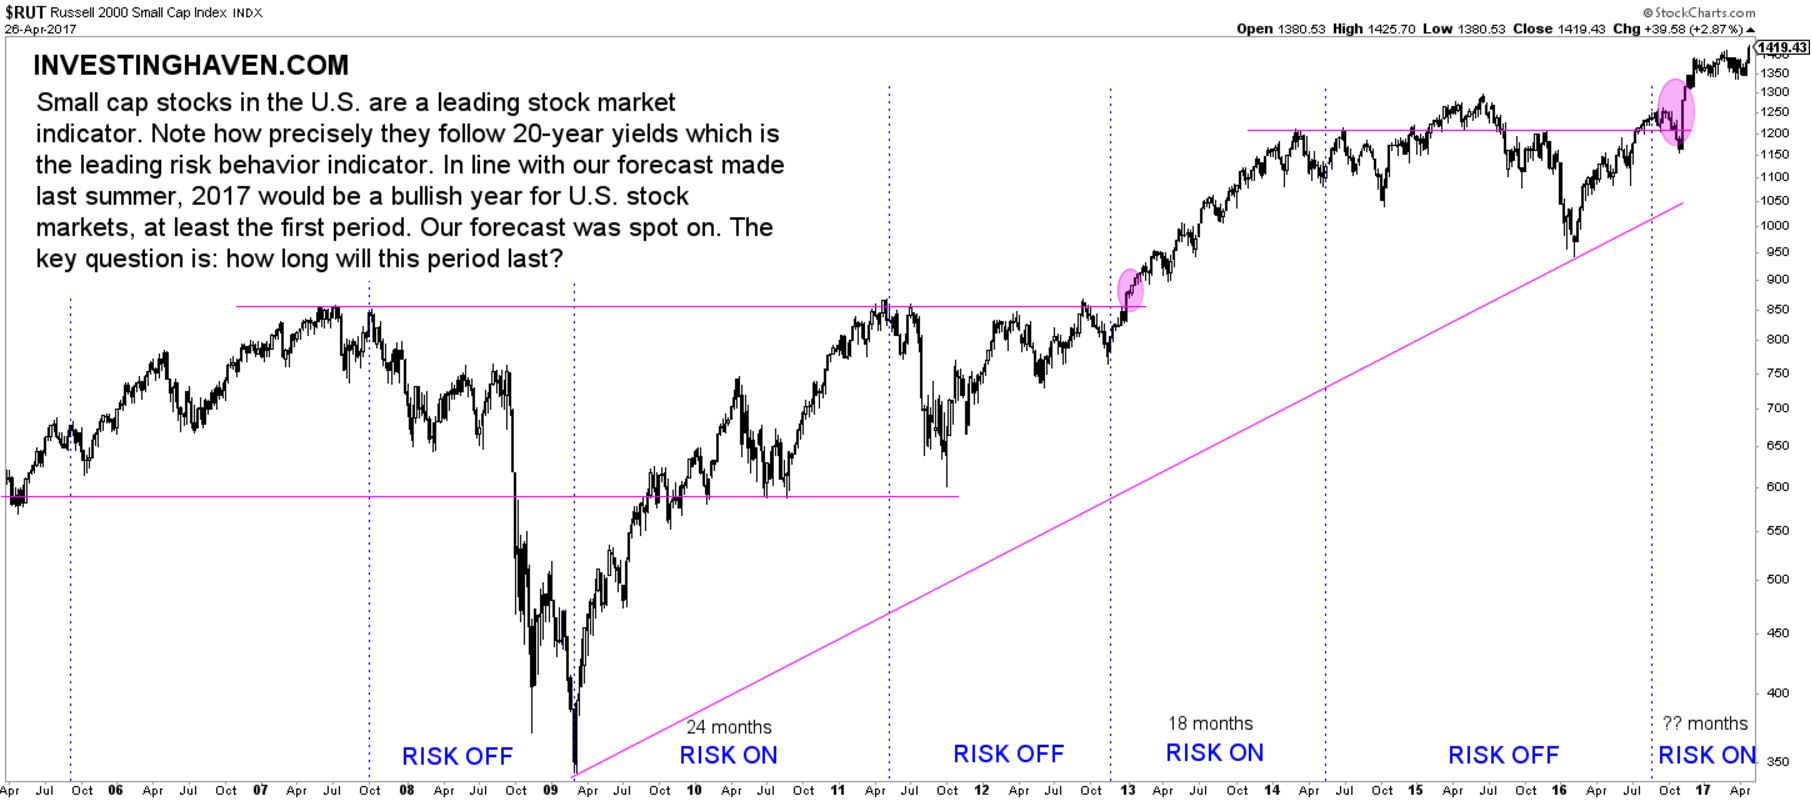
![[:en]gold mining space bullish signal[:nl]goudmijn aandelen bullish[:]](https://investinghaven.com/wp-content/uploads/2017/04/gold_miners_bullish_signal_2017.jpg)