Investing Haven
No Result
View All Result
Gold Silver Investing >>
CRYPTO INVESTING >>
  • 2026 Forecasts
    • 10 market predictions
    • Dow Jones forecast
    • S&P 500 forecast 2026
    • Nasdaq prediction 2026
    • Best altcoins to buy in 2026
    • Best crypto to buy now
    • Which crypto will explode
    • 15 crypto forecasts 2026
    • Which precious metal to buy
  • Silver
    • Silver prediction 2026 – 2031
    • Can silver hit $100?
    • Silver shortage
    • 50-year silver chart
    • Silver bullish reversal
    • Silver seasonality charts
    • How to invest in silver
  • Gold
    • Gold prediction 2026 – 2031
    • Will gold set new ATH?
    • Can gold hit $10,000?
    • Gold chart 10 years
    • Gold chart 50 years
    • Gold chart 100 years
    • Gold silver ratio
    • Gold seasonality charts
  • Commodities
    • Coffee forecasts
    • Sugar forecasts
    • Nickel forecasts
    • Lithium investing
  • Crypto forecasts
    • BTC prediction 2026 – 2031
    • ETH prediction 2026 – 2031
    • SOL prediction 2026 – 2031
    • XRP prediction 2026 – 2031
    • XLM prediction 2026 – 2031
    • BNB prediction 2026 – 2031
    • ADA prediction 2026 – 2031
    • AVAX prediction 2026 – 2031
    • KAS prediction 2026 – 2031
    • NEAR prediction 2026 – 2031
    • BCH prediction 2026 – 2031
    • LINK prediction 2026 – 2031
    • DOT prediction 2026 – 2031
    • SUI prediction 2026 – 2031
    • ICP prediction 2026 – 2031
    • LTC prediction 2026 – 2031
    • STX prediction 2026 – 2031
    • DOGE prediction 2026 – 2031
    • SHIB prediction 2026 – 2031
    • PEPE prediction 2026 – 2031
    • FLOKI prediction 2026 – 2031
    • WIF prediction 2026 – 2031
    • ONDO prediction 2026 – 2031
  • News
    • Crypto news
      • Bitcoin
      • Ethereum
      • XRP
      • Solana
      • Dogecoin
      • Cardano
      • Litecoin
    • Commodities
      • Gold
      • Silver
    • Markets & Stocks
    • Press Releases
  • Reviews
  • Login
Investing Haven
No Result
View All Result

Home » Commodities & Gold » Aussie, Leading Indicator For Commodities Is Trying Hard But Needs More Time

Aussie, Leading Indicator For Commodities Is Trying Hard But Needs More Time

Taki T. by Taki T.
March 20, 2021
in Commodities & Gold
Share on FacebookShare on Twitter

Commodities were hot in the aftermath of the Corona crash. First, gold and silver started moving (until last summer). Base metals came next. In recent months we saw strong momentum in special metals (cobalt, lithium, rare earths) as well as grains and some softs. What’s next in markets in 2021? Can we expect commodities to continue to shine? Are we in a commodities super cycle?

We take a look at the Australian Dollar, the Aussie, to get an understanding of the trend in commodities. It’s certainly not the only leading indicator, but it is a reliable leading indicator.

We take a classic top-down approach in reviewing trend patterns on the Aussie charts.

The monthly chart says it all. The Aussie recently hit a decisive level that goes back multiple decades: 0.81 points. No surprise it wasn’t able to break through it immediately. And the million dollar question is if and when it will move above it.

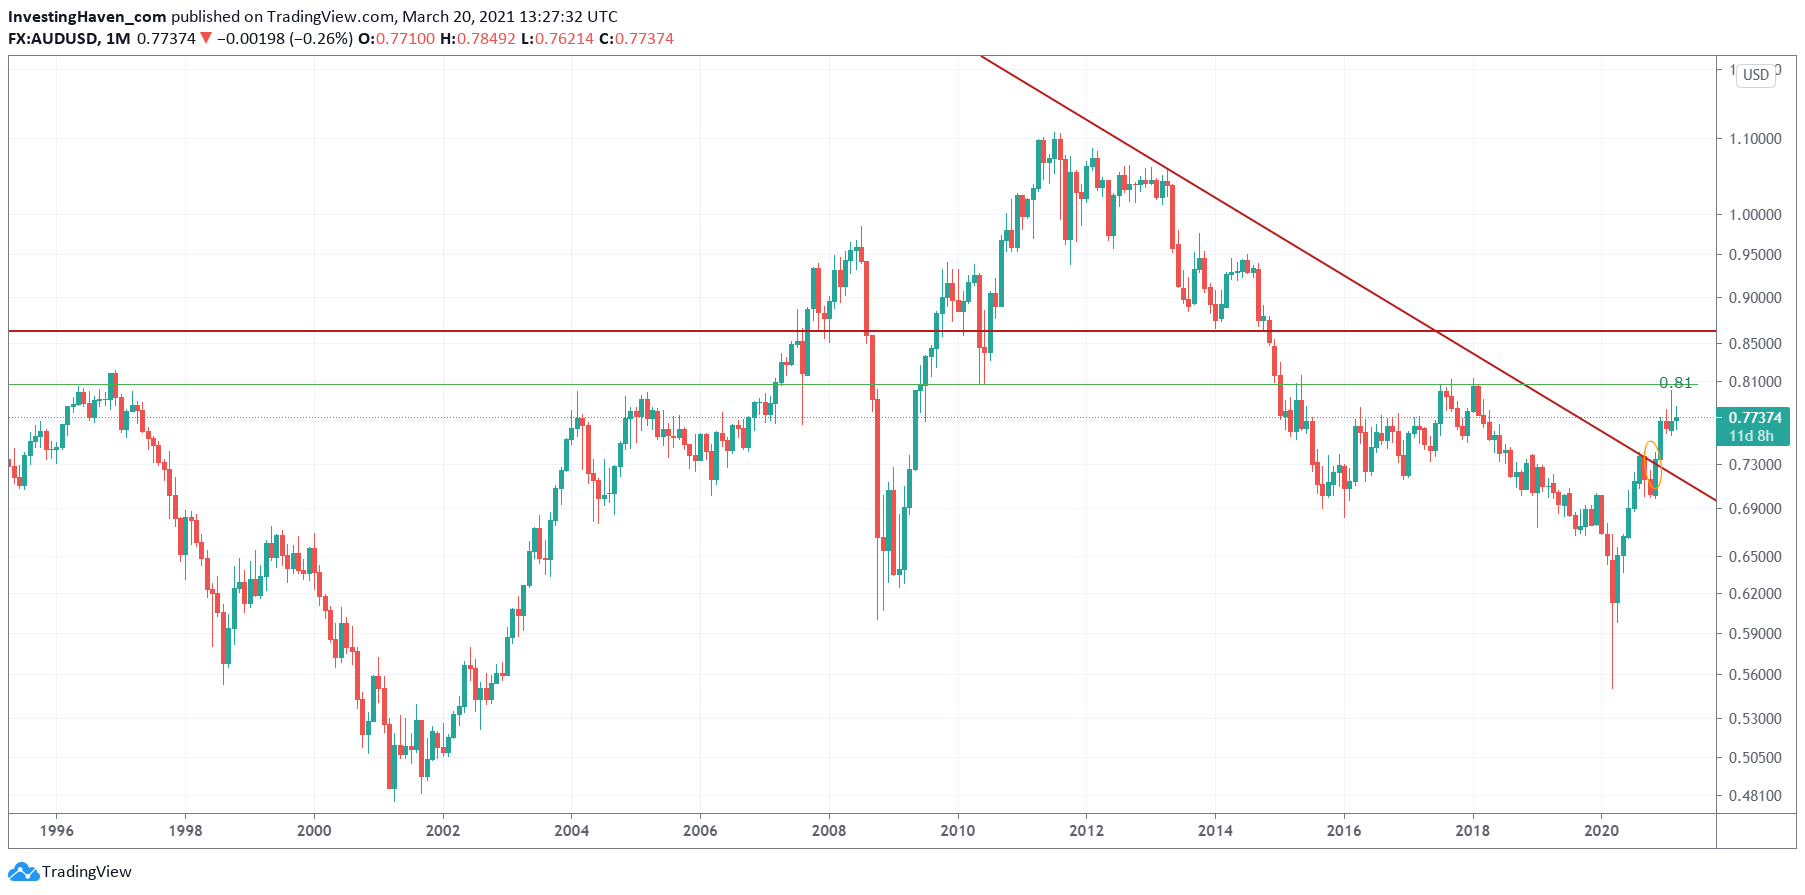
The monthly chart above has 2 more observations that are important, but for which we need the lower timeframe (weekly chart, below) for a better understanding:

  1. The falling trendline, say the bear market trendline, that goes back to 2012.
  2. The 6 year reversal pattern that goes back to 2014.

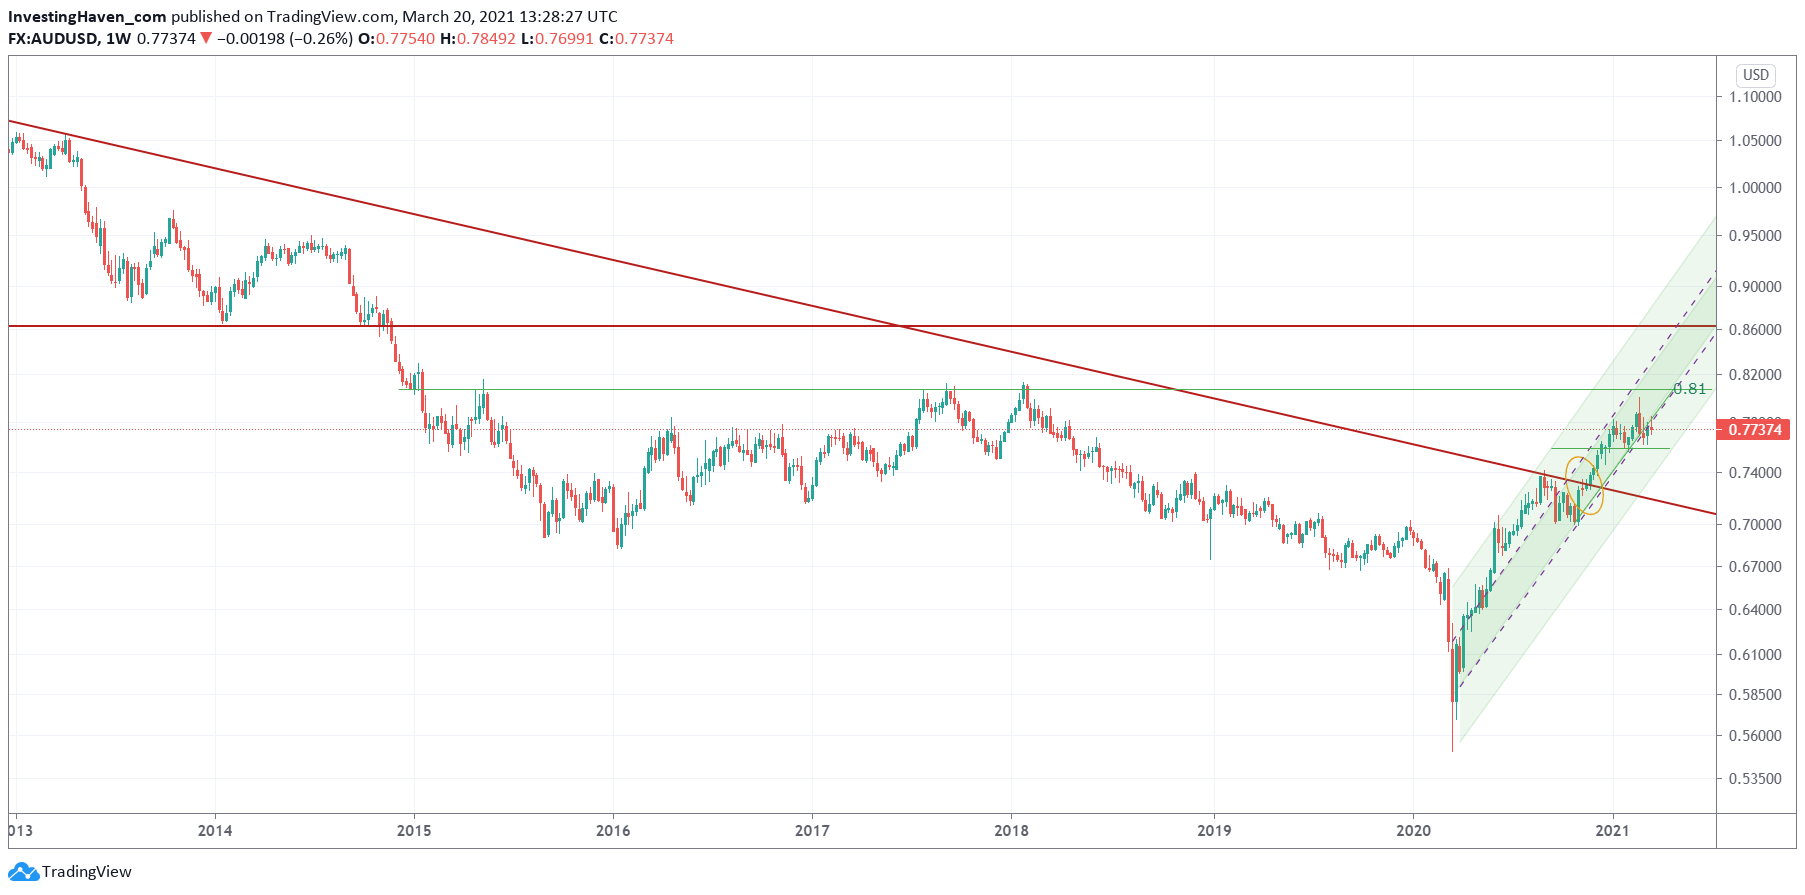
The weekly chart below shows how the bear market trendline (falling red line) was broken to the upside in November of 2020. The daily chart (3d chart in this article) shows the closeup. That’s very bullish, on all timeframes.

When it comes to the 6 year reversal pattern, since 2014, we see a long and slow reversal between 2014-2018, followed by a steep decline going into the Corona crash lows. That’s when the ‘right part’ of the bullish reversal started.

This chart doesn’t help us understand how we go from here, especially in completing the long term reversal. Do we need a long and slow reversal pattern similar to the one in 2015-2018? Or will this current rising trend (which started in November of last year, arguably in April of last year) continue at its current pace?

The daily chart only partially helps us answer the above question. And the way it looks, at present time, is ambiguous.

On the one hand we see a consolidation that started in the first week of January, after a steep rise in November/December. Flat until proven otherwise, is what one might conclude. And we would need a short term bullish reversal that will respect 0.765 in April and May of this year …. before we head to 0.81 and next 0.86 points.

On the other hand we could see a head-and-shoulder pattern that is playing out since the first week of January. In that scenario we are now completing the right hand shoulder, and it might be a topping pattern.

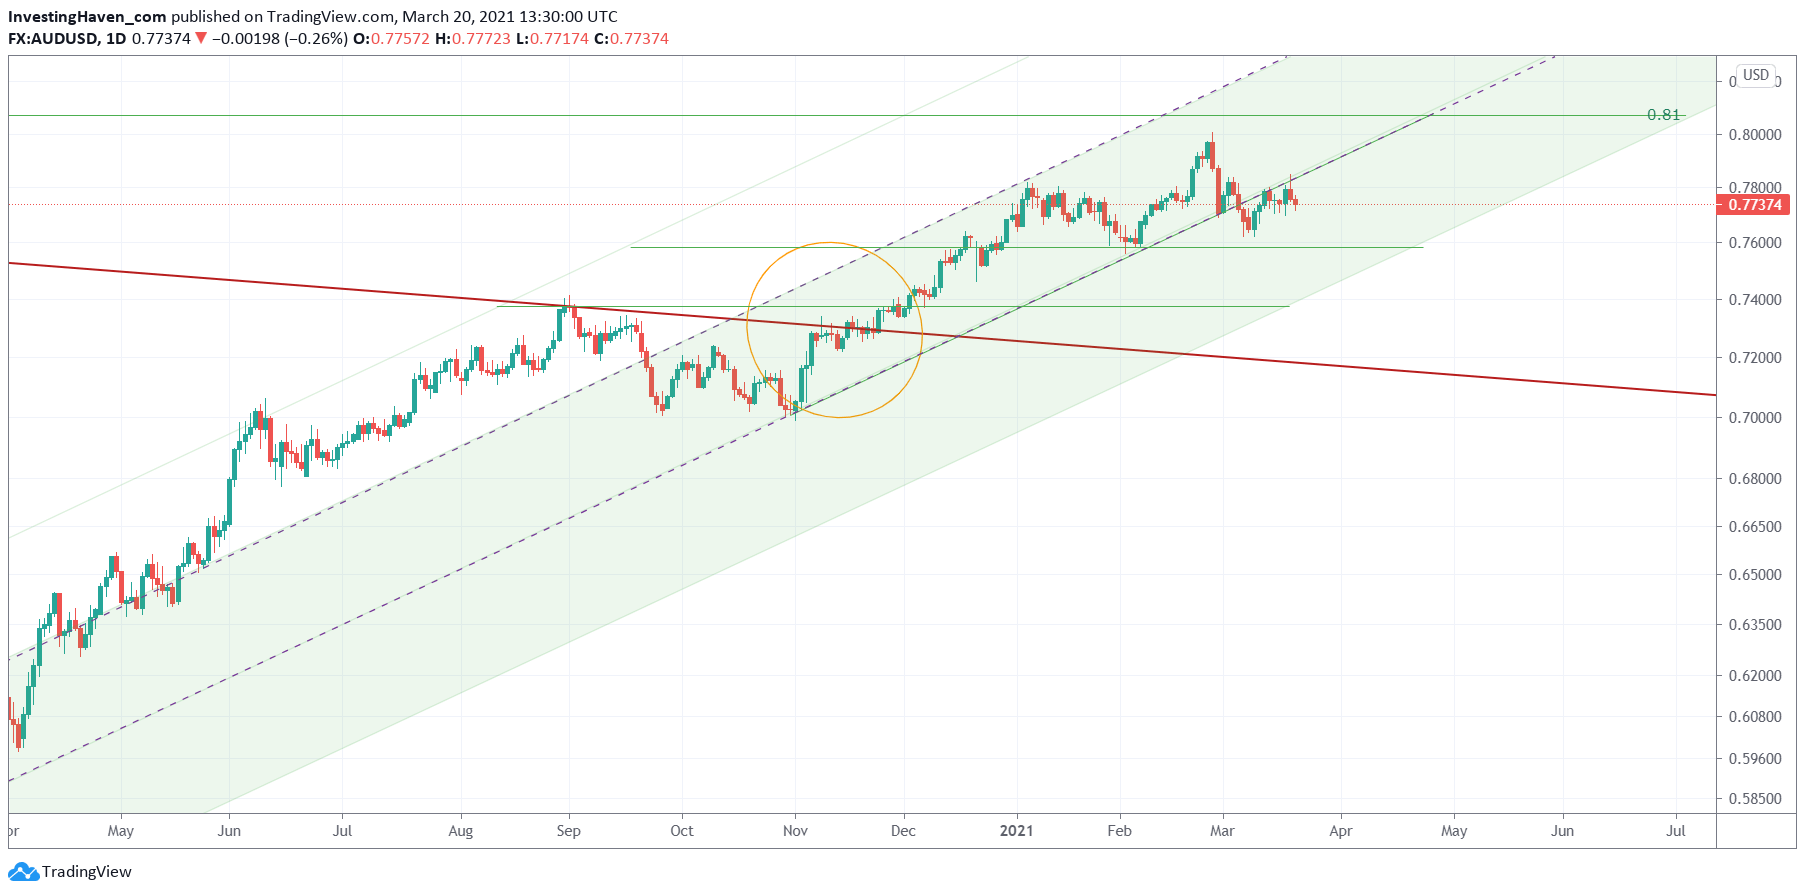
It’s clear that’s unclear at this point in time. The medium and long term trends are higher, and the November 2020 breakout after an 8-year bear market is probably indicative of a new secular bull market in commodities.

April will be an important month. It will be the month in which one of the two scenarios outlined in the commentary of the daily chart (above) will become clear.

Commodities need a rising (or flat) Aussie to be bullish. A falling Aussie will not be good for most commodities. Moreover, we do know from history that commodities don’t rise simultaneously, they move in clusters.

All this implies that as long as the Aussie respects 0.76 points we will see some commodities do well, and others consolidate. We believe that April will be a decisive month for the medium and even long term outlook for commodities as an asset class.

10-YEAR ANNIVERSARY OFFER: InvestingHaven.com celebrates 10 years. Temporarily, you can enjoy a discount on our premium gold/silver and crypto reports. Or you can become a VIP member. Go to our anniversary deals >>
Receive our weekly newsletter.

premium service SP-500   premium service trade alerts   premium service crypto teaser  

No related posts.

Tags: AUDUSD
Taki T.

Taki T.

Taki is a chart analyst who is passionate about unlocking unique insights out the chart. While the vast majority of analysts remain focused on price analysis, Taki starts with timeline analysis and adds price analysis to this. In doing so, he developed a unique methodology to find opportunities in financial markets, across assets and markets.

Connect with InvestingHaven

Receive top notch forecasts for free.

*We hate spam as you do.

Site Navigation

  • RSS Feed
  • Advertising
    • Sponsored Content Policy
  • Advertising Disclosure
  • Risk Disclosure
  • Privacy Policy
  • Terms of Service
  • Sitemap
  • About us
  • Contact Us
investing haven logo

Precious metals market analysis including gold and silver price predictions. Crypto market analysis including highly accurate BTC ETH SOL XRP forecasts.

Copyright © 2025 InvestingHaven

Login to your account below

Forgotten Password?

Fill the forms bellow to register

All fields are required. Log In

Retrieve your password

Please enter your username or email address to reset your password.

Log In

Receive top notch forecasts for free.

*We hate spam as you do.

The views and opinions expressed in this article are solely those of the author and do not necessarily represent the official position, policies, or views of InvestingHaven or its affiliates. This content is provided for informational purposes only and does not constitute financial, investment, legal, or other professional advice. Readers are advised to conduct their own research and consult with a qualified financial advisor before making any investment decisions.

No Result
View All Result
  • 2026 Forecasts
    • 10 market predictions
    • Dow Jones forecast 2026
    • S&P 500 forecast 2026
    • Nasdaq prediction 2026
    • Best crypto to buy now
    • Which crypto will explode
    • Best altcoins to buy
    • 15 crypto forecasts 2026
    • Which precious metal to buy
  • Silver articles
    • Silver prediction 2026 – 2030
    • Can silver hit $100?
    • Silver shortage
    • 50-year silver chart
    • Silver bullish reversal
    • Silver seasonality charts
    • How to invest in silver
  • Gold
    • Gold prediction 2026 – 2031
    • Will gold set new ATH?
    • Can gold hit $10,000?
    • Gold chart 10 years
    • Gold chart 50 years
    • Gold chart 100 years
    • Gold silver ratio
    • Gold seasonality charts
  • Commodities
    • Sugar forecasts
    • Coffee forecasts
    • Nickel forecasts
    • Lithium investing
  • Crypto forecasts
    • BTC prediction 2026 – 2031
    • ETH prediction 2026 – 2031
    • SOL prediction 2026 – 2031
    • XRP prediction 2026 – 2031
    • XLM prediction 2026 – 2031
    • BNB prediction 2026 – 2031
    • ADA prediction 2026 – 2031
    • AVAX prediction 2026 – 2031
    • KAS prediction 2026 – 2031
    • NEAR prediction 2026 – 2031
    • BCH prediction 2026 – 2031
    • LINK prediction 2026 – 2031
    • DOT prediction 2026 – 2031
    • SUI prediction 2026 – 2031
    • ICP prediction 2026 – 2031
    • LTC prediction 2026 – 2031
    • STX prediction 2026 – 2031
    • DOGE prediction 2026 – 2031
    • SHIB prediction 2026 – 2031
    • PEPE prediction 2026 – 2031
    • FLOKI prediction 2026 – 2031
    • WIF prediction 2026 – 2031
    • ONDO prediction 2026 – 2031
  • News
    • Crypto news
      • Bitcoin
      • Ethereum
      • XRP
      • Solana
      • Dogecoin
      • Cardano
      • Litecoin
    • Commodities & Gold
      • Gold
      • Silver
    • Markets & Stocks
  • Premium Crypto Alerts
  • Premium services

Copyright © 2025 InvestingHaven