One of the top performers today was First Majestic Silver (AG) with a rise of some 6%. Is this the start of a new bull market? Is our long awaited First Majestic Silver stock forecast about to materialize? The short answer: one day does not make a market. Moreover, we really need to see continued strength in precious metals, with precious metals prices to start moving towards our gold forecast and silver forecast. Only then will we start seeing the breakouts we anticipate in our silver stocks forecast, and in particular First Majestic Silver.
We covered First Majestic Silver extensively this year. This is the sequence of articles we published:
First Majestic Silver: What’s Going On With This Top Silver Stock? (May 2019)
First Majestic Silver Continues Its Nerve-Wracking Breakout Process (April 2019)
First Majestic Silver Among The First Silver Miners To Officially Break Out (April 2019)
First Majestic Silver Breaks Out, About To Double In 2019 (Feb 2019)
First Majestic Silver: Time For A Big Move After 20 Flat Months (Feb 2019)
First Majestic Silver: Fireworks In The Making In 2019 (Jan 2019)
As said many times it is imperative to take a top-down approach: first the big picture and sector viewpoint, followed by the lower timeframes like the daily chart.
In terms of big picture view the silver market continues to consolidate in its falling pattern. Similarly, gold trades in its falling channel but has signs of consolidation.
Only if gold and silver will gain bullish momentum will we see precious metals stocks rise.
First Majestic Silver: Which Chart Has The Truth?
When it comes to the chart of First Majestic Silver we have this observation that is slightly confusing to us.
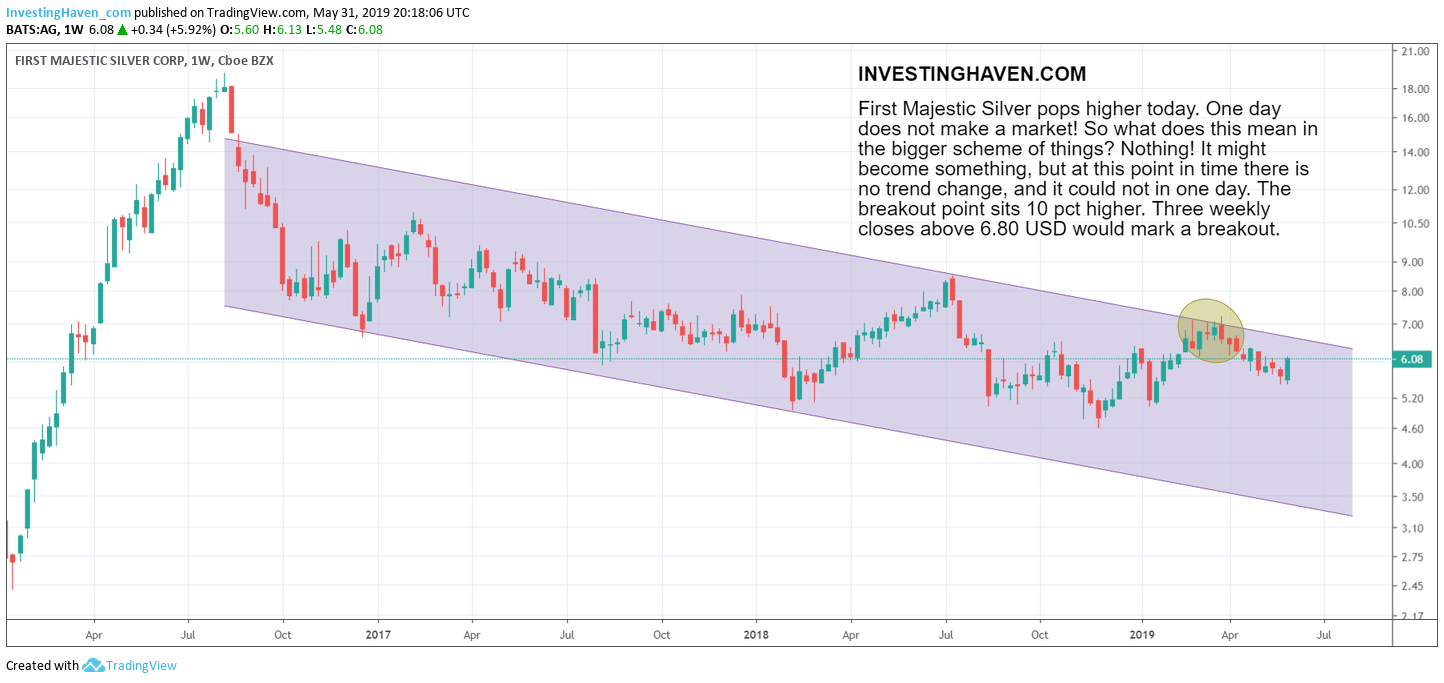
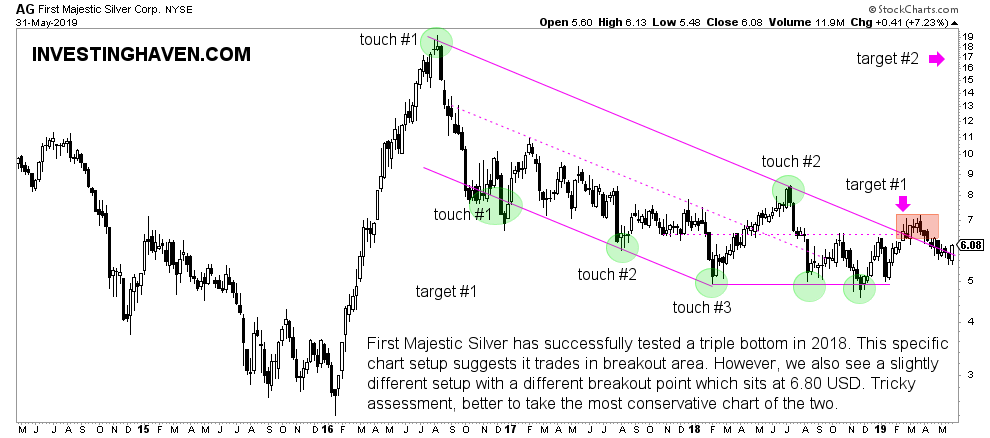
Two charts from different charting services show a different channel. This is crucial because we rely on chart patterns to signal the trend.
The first chart shown below is the weekly timeframe from First Majestic Silver on TradingView. It shows a pattern with the start of a breakout in February (see also our article above) which eventually failed after 3 weeks.
Right now, according to this particular pattern, First Majestic Silver trades 10 pct below its breakout point.

However, a similar First Majestic Silver chart on StockCharts suggests the breakout did take place, and the recent decline since March is part of a breakout test.

Which of the two charts should we believe?
In this situation we prefer to take the conservative view: the chart with the most conservative channel is the one we want to follow.
How to play First Majestic Silver?
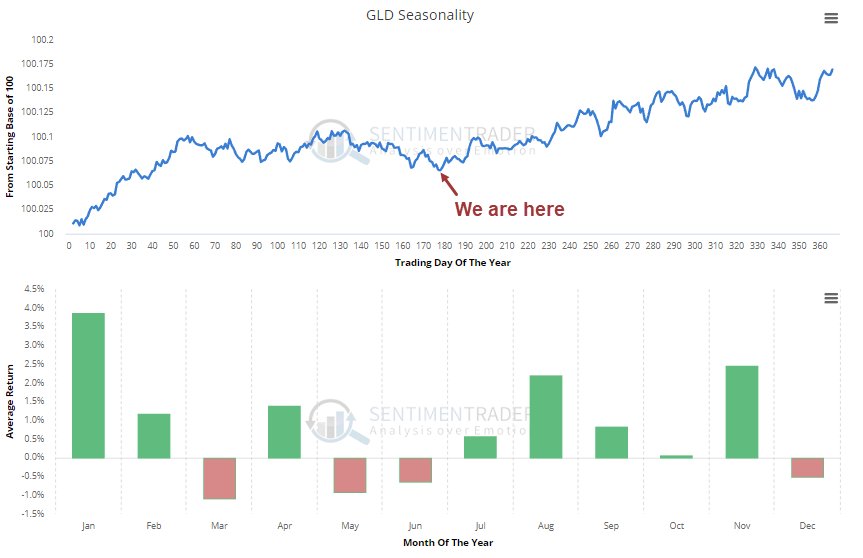
We first want to see strength in gold. Traditionally, June is the weakest month of the year in the February and December timeframe. Seasonality is not a primary indicator, but a secondary indicator. But combined with our viewpoint that Gold Has More Upside Than Downside Potential we expect First Majestic Silver to start picking up in the next 4 to 8 weeks.
Is it too late to enter? No.
Is it worth exiting now? Not really.
We are patiently waiting for a major move in precious metals, it may come in the next months, it may come later. The point in the gold market is this: you better want to be in earlier than too late because the trends are always powerful.


