It was a week in which everything got crushed, with the exception of Treasuries, the Euro and the US Dollar. It look like gold would become the safe haven play, until Friday morning when gold and silver started an epic sell off. No, our gold forecast nor our silver forecast did invalidate. Especially because we are hitting rock solid bottoms.
There is one chart that we feature to the members of our premium Momentum Investing service. Note that our premium members got almost daily updates this week, with insights and exclusive chart that we do not share in the public domain. We followed this epic global selling crash closely.
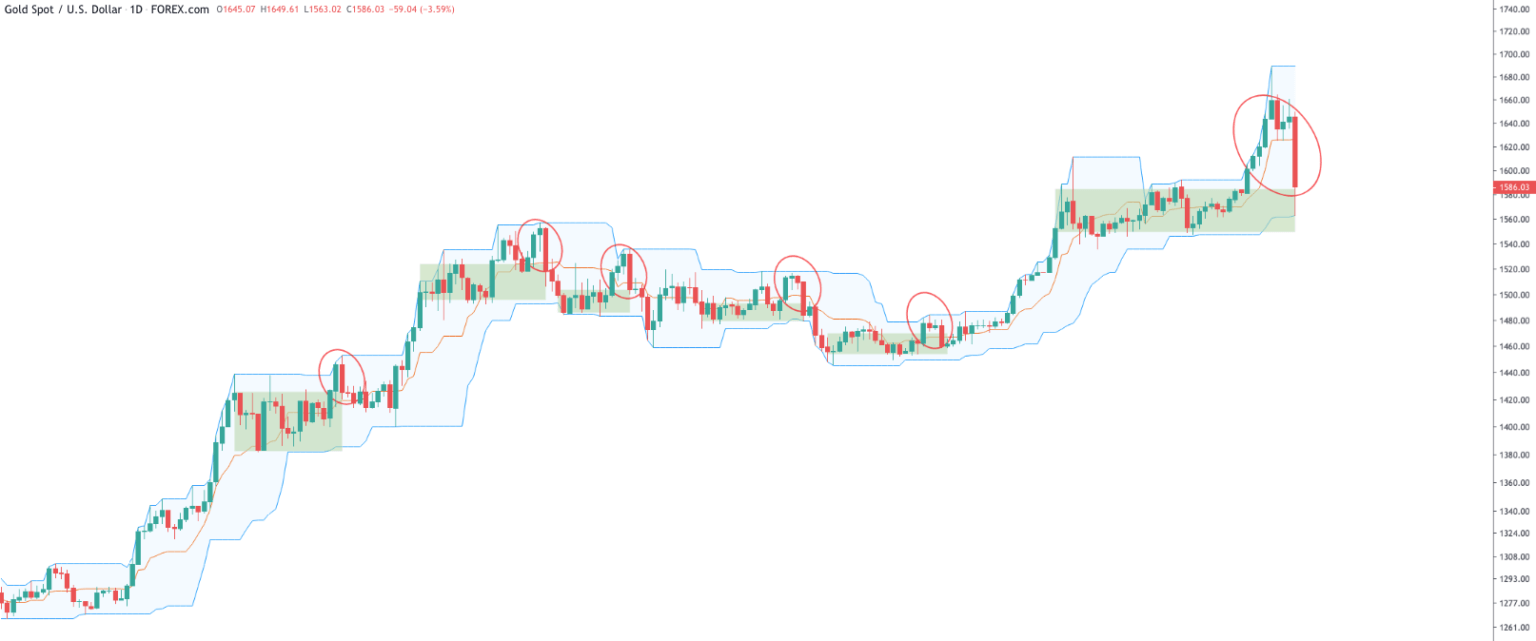
Below is the gold price chart which is one of the many charts that we will share later today in our premium Momentum Investing service.
Although gold’s decline was epic, and even cataclysmic, it stopped exactly at the point where it had to stop to remain in an uptrend.
The chart below features the Donchian Channel which is an indicator to measure oversold and overbought levels. We hardly ever use this indicator, only if we want to understand if a rise or decline is extended.
Note how precise gold’s price crash behaved: it stopped right at support levels of this Donchian Channel, and the end of day relief recovery pushed it above the consolidation area and breakout point at 1557 USD.

We are looking at the gold mining space as a potential momentum play for our medium term portfolio Momentum Investing. With this week’s epic sell off it is not clear yet if and when we have to re-enter gold miners. We firmly believe they will bounce but timing an entry is crucially important (as always). Long term portfolios can have some quality gold miners until we see *really* concerning price behavior and violation of critical price points on the gold chart, first and foremost 1557 USD/oz.


