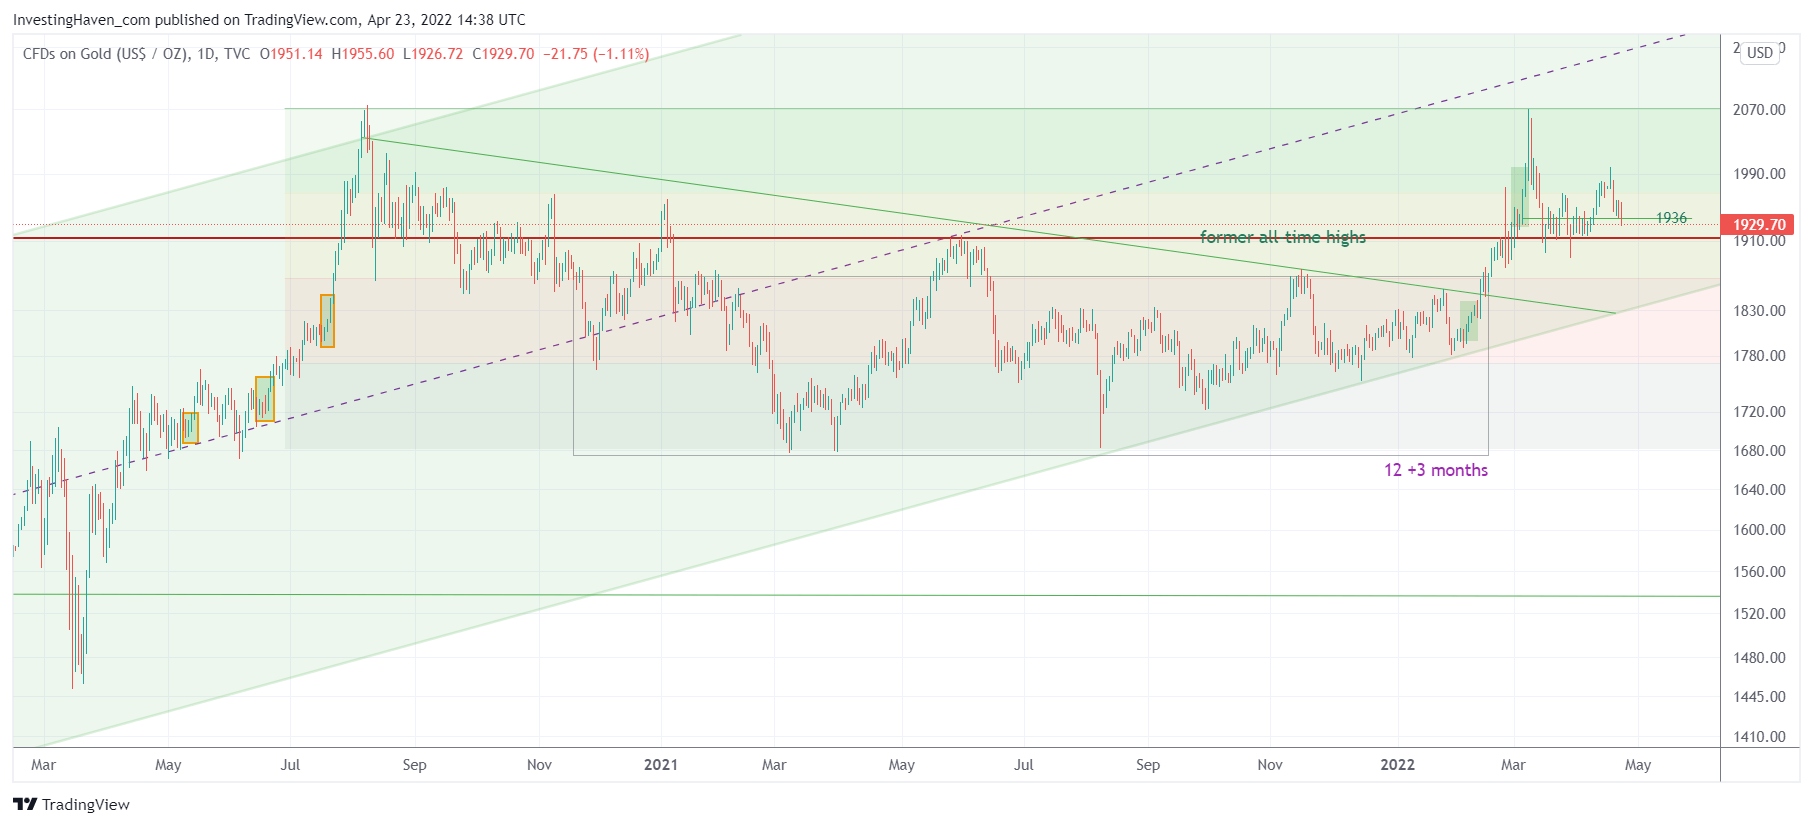
Not a lot, is the short answer to the question what is going on in gold. After a strong run that cleared former highs in 2011, touching ATH printed in 2020, gold is now going through a healthy retracement. Our gold forecast for 2022 is well above current levels. But is gold really on track to clear the 2100 level and move to the 2300-2500 area?
We believe the answer is YES but there is also a very important condition that we have to call out: the USD!
The gold chart has a really long W reversal which comes with a lot of power. The chart pattern in and on itself is strong enough to push through 2100 USD/oz.
 But the big problem for gold is the USD.
The USD is strong, too strong, way too strong.
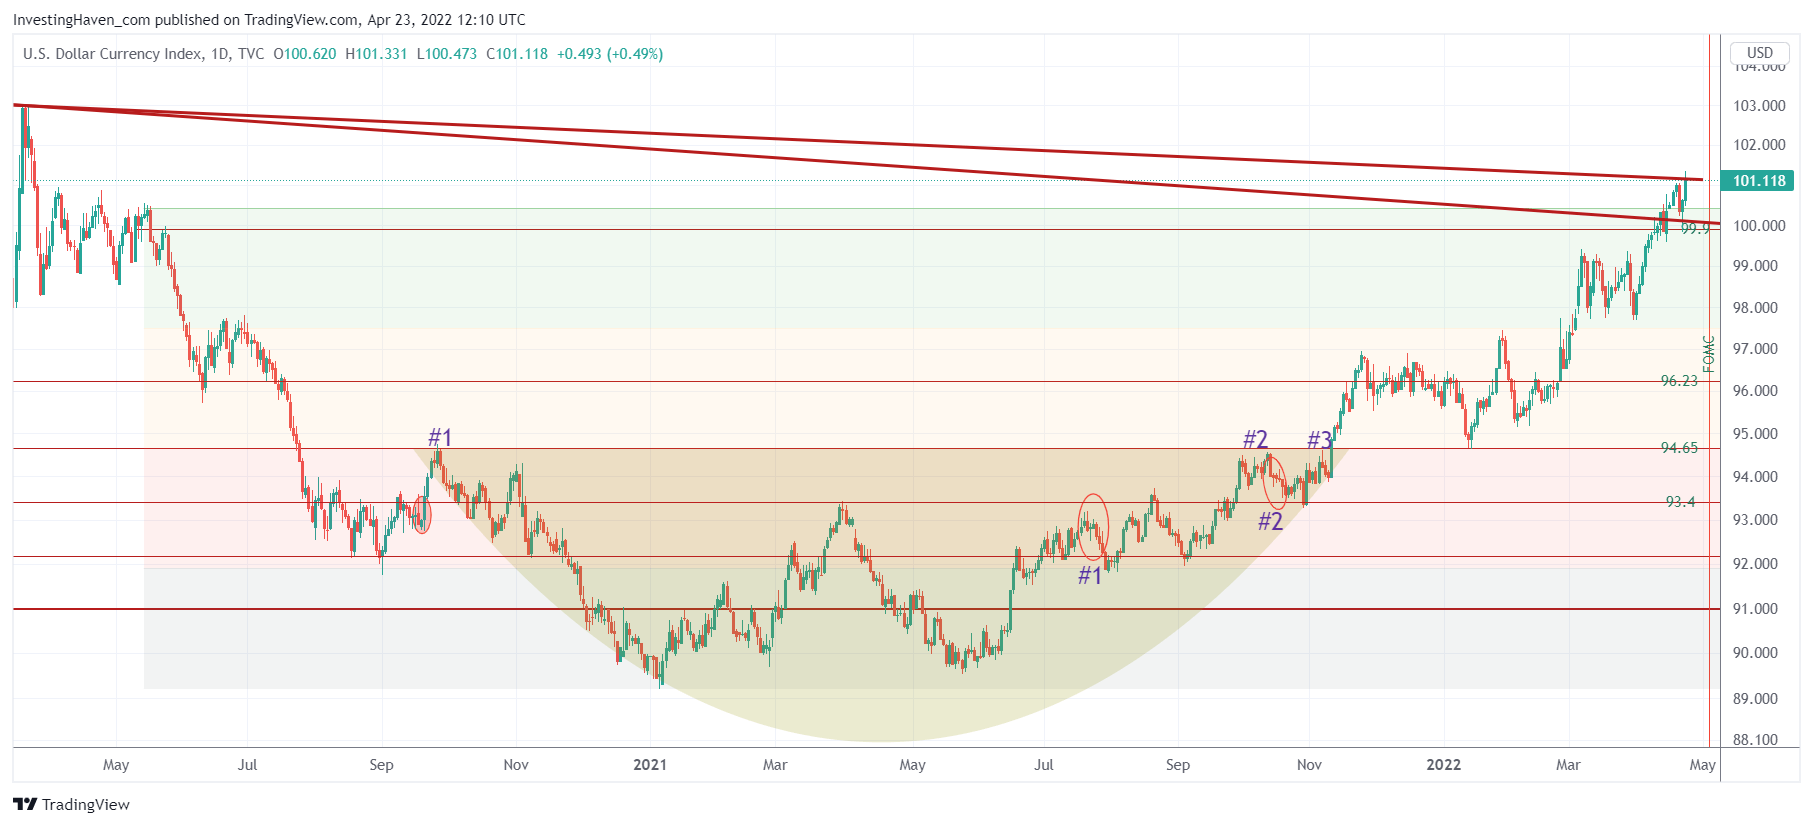
If you love reversals, you must love the USD reversal. However, a bullish USD tends to create damage in metals and markets, so while the chart pattern of the USD is gorgeous the impact it is creating on metals and markets is less gorgeous.
You noticed the falling red trendlines on the above daily chart?
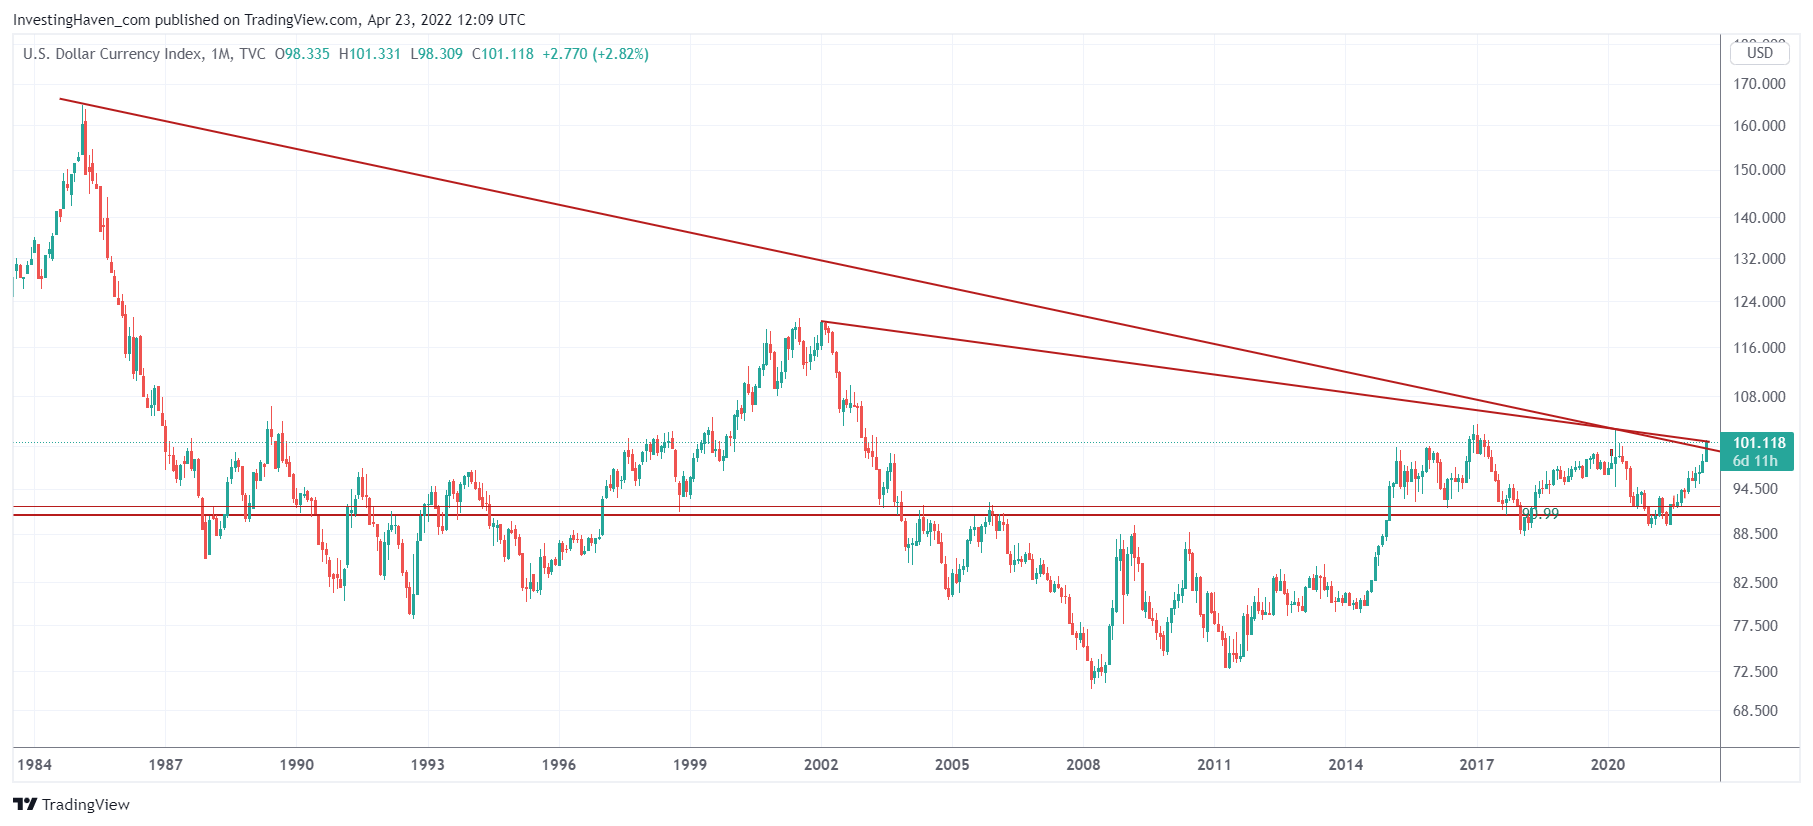
Here is where those trendlines are coming from, on a higher timeframe: the monthly chart.
Make no mistake, those 2 trendlines are extremely important. Extreme emphasis on ‘extremely’.
No jokes here, the USD closing on its monthly chart above 102-103 points might open the door for a run to 120 points. That won’t be pretty for metals and markets, mark our words.
Yes, next week Friday will be a very important day, with crucial impact that will come with reading in leading indicators like the USD.
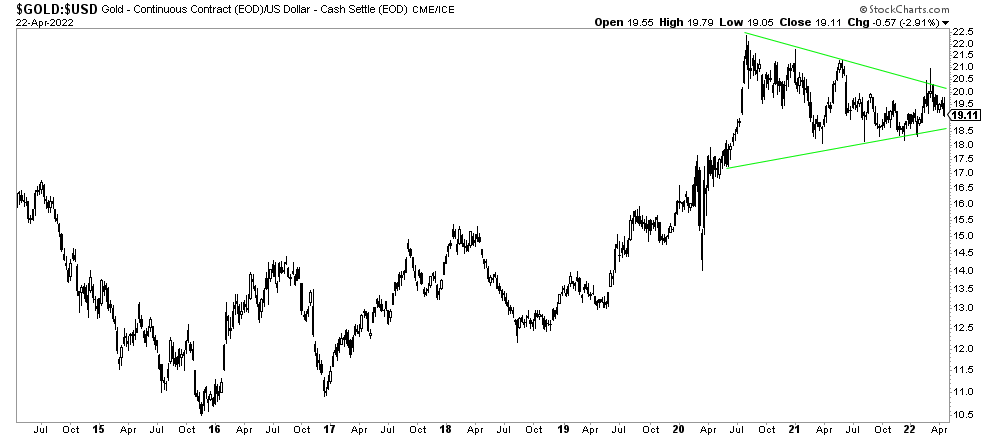
For now, we see that gold is not really impressed by USD strength. The gold vs. USD ratio, not to be confused with gold denominated in USD, is holding up pretty well. It also suggests what could happen to gold IF the USD would stop rising here. This, and many more charts, will be included in the Momentum Investing weekend update which will feature a record number of must-see charts (scheduled for end of day today).


