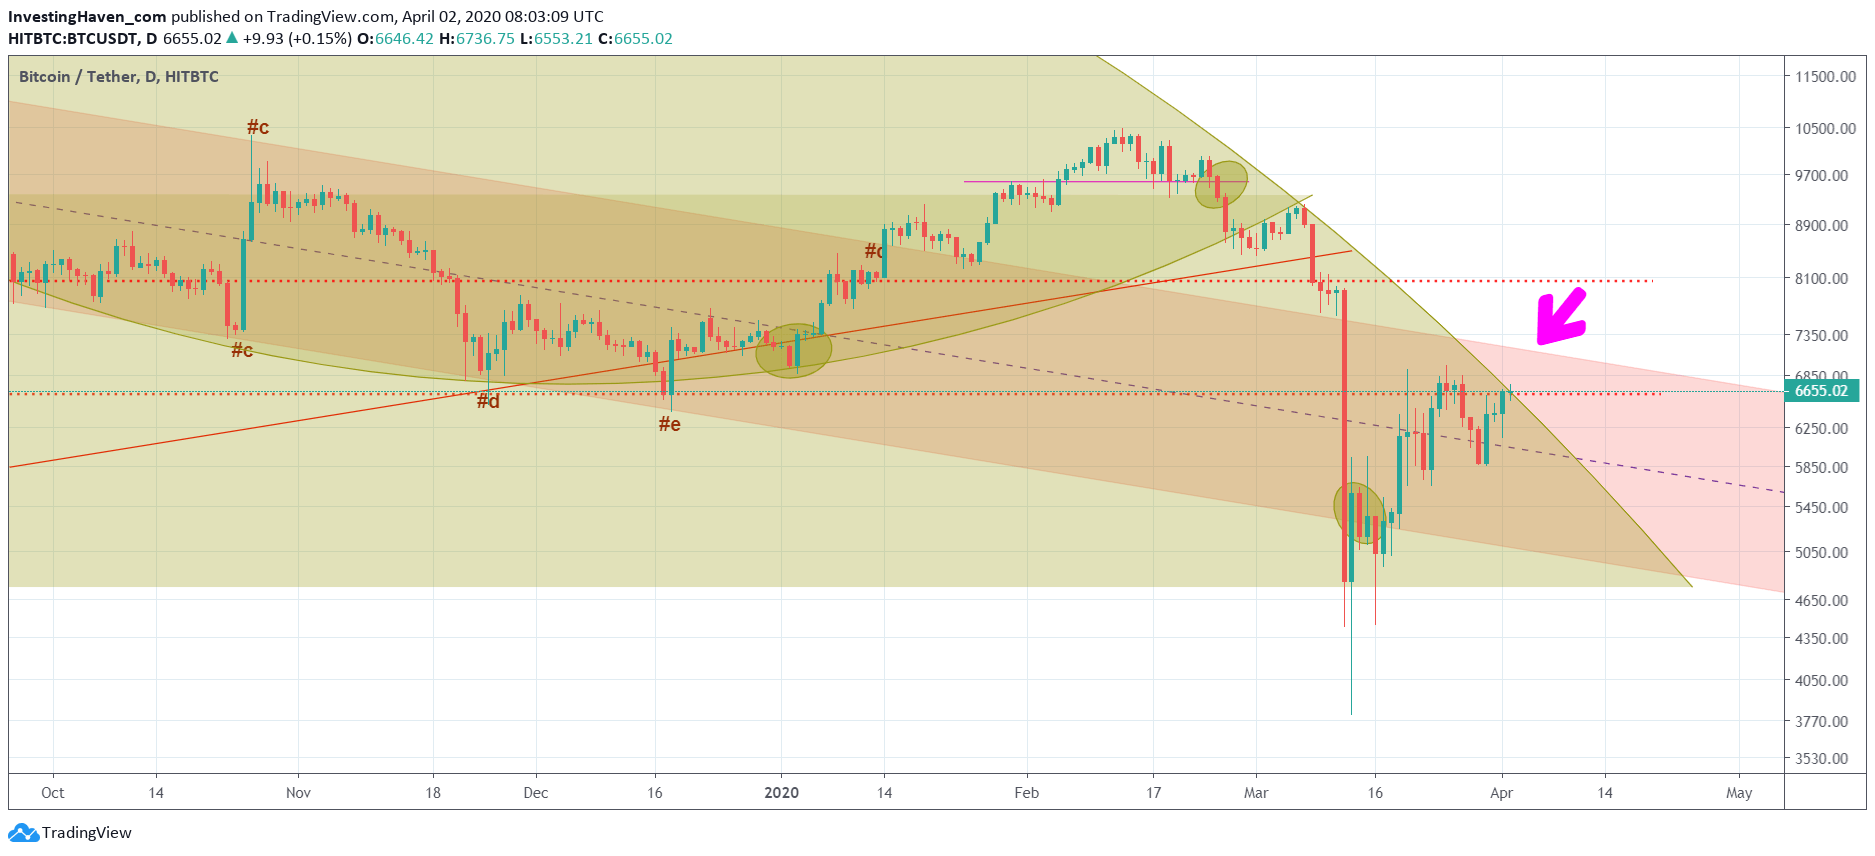
Talking about crucial moments in global markets. We already signaled the possibility of the Corona Peak Fear Indicator About To Peak Again, also Gold Price Testing Critical Support 1557 USD, Stocks Market: V Reversal, W Reversal Or Crash Continuation? … Here is another one: the crypto market is testing a make or break level. Bitcoin’s chart has one potential bearish case, and it is being tested ‘as we speak’. Note that this chart is not featured in our Bitcoin forecast but only in our premium crypto investing section. So readers should consider this chart a teaser into the wealth of charts we share with our premium crypto members.
We shared some 20 exclusive crypto charts to our members this week. They show exactly where the crypto market stands, and where it is potentially headed.
One of the most important charts is the potential bearish case for Bitcoin: a giant bearish reversal that started in April of last year (with Bitcoin’s major bullish breakout). The recent crash lows at 4650 USD (closing price) was a retest of that breakout point. With this, Bitcoin has a potential bearish reversal pattern on the chart.
Note: we are not saying Bitcoin is bearish. We stress the word ‘potential‘ as in markets there are always 2 ways to look at any chart: a bearish view and a bullish view.
The art of the chart is about respecting both views, and tracking price action to confirm if the bearish vs. bullish trend is materializing.
At this point in time we see this critical 6600 USD level being tested. Former support (December of 2019) is now resistance since the Corona crash.
If Bitcoin manages to rise above 6600 USD for 3 consecutive days it is invalidating its bearish setup.
Ideally of course we need a 3 week confirmation before being 100% sure.
Stay up to date with the evolution in the crypto market by become a premium crypto member.


