InvestingHaven’s research team analyzes hundreds of crypto charts per week. With the highest level of confidence we conclude that Ripple has the most beautiful cryptocurrency chart going into 2019. Being aware that we are repeating ourselves, as said in our Ripple forecast 2019 and, more recently, our Ripple fundamental analysis, both sugges that XRP token moves to 20 USD. Today, the market gave us additional evidence that our forecast will come true. With a 12% rise XRP is the best performing cryptocurrency in the top 100 today, on no ‘visible reason’ …
Well, not that fast, there is plenty of reasons why Ripple’s XRP token (XRP) is on the move. In fact, in both articles mentioned above, we shared plenty of evidence why Ripple would outperform. Sooner rather than later this materializes.
What exactly triggered the buying today is not important. The fact that there is strong buying on a seamingless unimportant day, where most cryptocurrencies in the top 10, even top 100, are trading flat, is by far the most important fact!
Presumably, this is institutional buying kicking in. We highlighted yesterday that as per Ripple’s Q3 quarterly market report the company (Ripple) clearly saw first signs of institutional money flowing into Ripple’s XRP token. This is what the chief strategy officer of Ripple had to say:
The big change [in Q3] was in the buying by Wall Street. The buying by institutions directly from the company. That numbers was up really big nearly 400% quarter-over-quarter. There seems to be little signs that Wall Street is moving closer and closer towards adopting digital assets.
Again, the sentence we underlined is the one that stands out.
This is also perfectly in line with our article on Medium which we published way before Ripple’s report in which we discuss why Ripple will benefit indirectly from Bitcoin futures:
Our conclusion after doing this exercise? For institutional investors the highest level of confidence will probably be for Ripple and its XRP token, followed by Bitcoin, Ethereum and Stellar Lumens.
Today’s 12% rise certainly has something to do with this, there is almost no other explanation possible!
Ripple Has The Most Beautiful Cryptocurrency Chart Setup Going Into 2019
One day does not make a market, admittedly.
Still, the 12% rise of today adds to the already beautiful chart setup that Ripple was moving into.
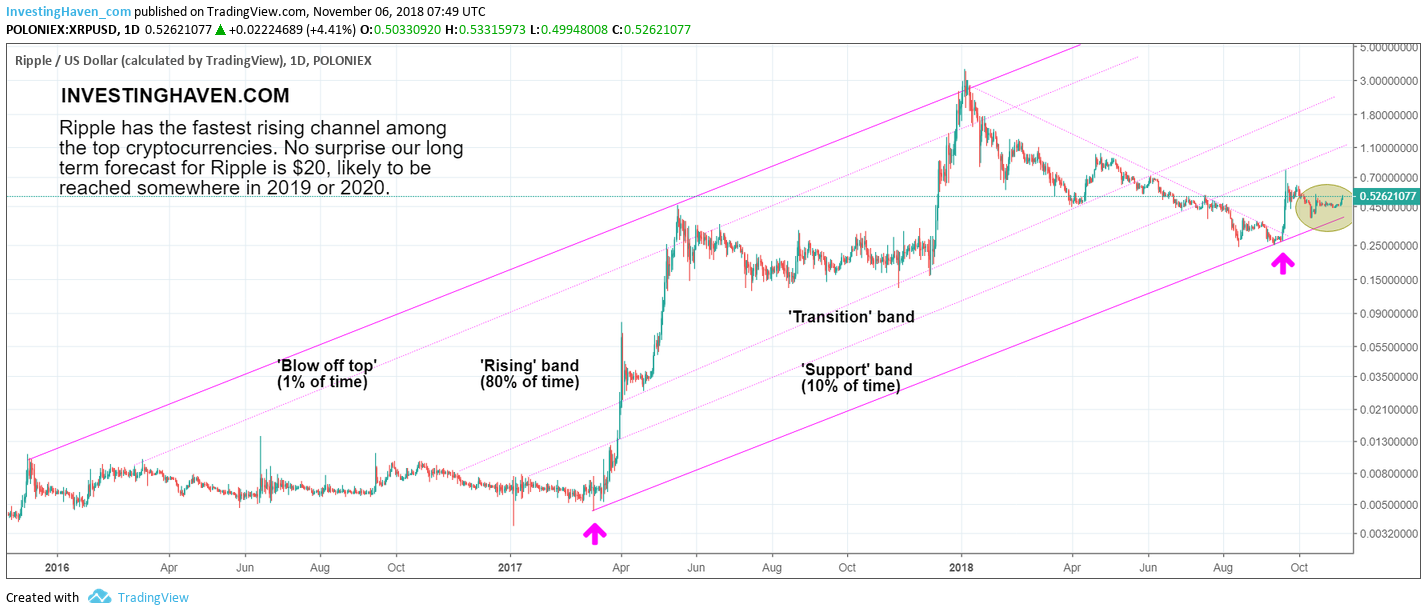
Below is the long term chart which is only available for premium subscribers of InvestingHaven’s blockchain & crypto investing research service (the first of its kind in the world). From time to time we open up our cook book, and publish a very limited amount of materials in the public domain. The chart below is one of those materials. You too can subscribe to get access to all crypto research.
This long term chart of Ripple’s XRP token is very clear and concise: Ripple is making its way higher, and it confirmed its long term rising pattern by the test of support in August/September of this year, as annotated wit the purple arrow.
This pattern seems simple, but make no mistake it is incredibly powerful. The fact that Ripple built a long base throughout 2016 which was the basis for its rising trend channel is exceptionally strong. Hardly any cryptocurrency chart has the same setup. That’s why we consider Ripple having the most beautiful cryptocurrency chart setup going into 2019.
Ripple is now moving to the $1.2 area. The pace at which it gets there will depend on Bitcoin as well: the more supportive Bitcoin’s price the faster Ripple will test $1.2.
Things can move fast after $1.2 as the ‘transition’ band mostly serves as a gateway to the ‘rising’ band in which Ripple’s price tends to trade most of the time. That’s above $3. You heard this very well. InvestingHaven is on record saying that Ripple will easily rise above $3 in 2019 provided Bitcoin is supportive.
What happens next and how to play this for maximum returns? Those are insights only reserved for our premium crypto subscribers >>


