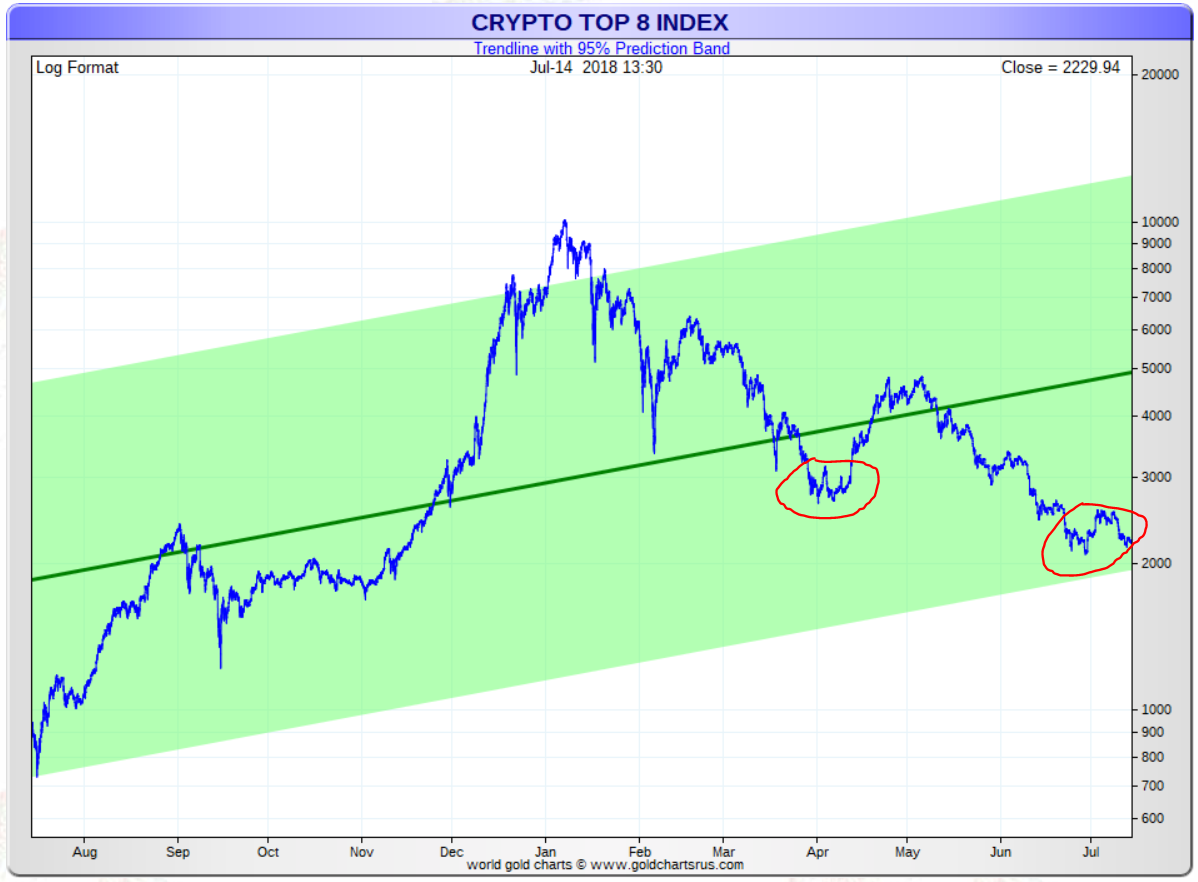
In the last weeks we shared a couple of crucial insights, both with premium subscribers of our blockchain investing research service as well as in the public domain. Let’s quickly recap them, and see how things are evolving in the crypto market primarily with the intent to understand whether the grand bull market is over or whether this is the last chance to get in before the next (maybe last) leg higher starts. Let’s also look at our intramarket crypto indicator which still is (hugely) bullish!
Last week, in This One Chart Confirms The Crypto Market Is Still In An Uptrend, we said that the uptrend is still intact, based on the leading intermarket indicator we apply in our methodology:
Right now, there is one chart particularly that makes us bullish, the one embedded below. It shows both the price of Bitcoin as well the prices of technology stocks represented by the NASDAQ index. Why is this chart and the correlation between both assets so important? Because crypto tends to move in tandem with tech stocks, and because tech stocks go higher when markets are in a RISK ON environment … and so does the crypto market. So the circle is complete.
In this article Bitcoin At Crossroads: Flat Price Until The Start Of A New Trend written two weeks ago we wrote the following:
This is a mid term type consolidation which has one characteristic: it strongly frustrates both traders and investors. This is the type of situation in which the vast majority of traders and investors show no patience, sell with a loss, only to find themselves chasing prices higher after x number of months (maybe one or two years). That is how Mr. Market works, and (crypto) investors better understand this dynamic before falling victim.
The week before, in Bitcoin Breaks Below $6000: What Now?, we said, on the day Bitcoin was about to fall apart and break below the important $6k level:
The question should be asked: is this a formidable buy opportunity as opposed to a reason to panick? We strongly believe the answer is YES, the reason being that the longer timeframe points out that we are not very far away from a bottom. Where do we see this? On the longer term timeframe. As always, once the daily timeframe is not revealing more info about long term trends and forces at play in the form of clear patterns, it is mandatory to zoom out. The challenge with Bitcoin’s price chart is that zooming out paints a wrong picture given the scale of the axes. That’s why a logarithmic chart is a must, certainly on the longer term timeframe(s).
Why do we keep on repeating ourselves? Very simple, as the attention span of investors tend to decrease over time. That is a huge risk to their portfolio! With social media and an overdose of content being published ‘day in day out’ it is very easy to change focus continuously. This may result in loss of focus on what really matters. Now that is exactly the key premise of InvestingHaven and its research team: we remain focused on what really matters based on our 1/99 Investing Principles which says that only 1 pct of the news is important and that investors must stay focused on 1 pct of the price points on charts.
Our leading intramarket indicator, the top 8 cryptocurrencies index, is still correcting within a rising channel. Any damage done so far on the grand bull market? No, there is no damage done so far. As long as prices remain in this rising channel there is no reason whatsoever to panick.
We remain confident that, per our initial forecast of January 27th, this crypto crash and retracement will be over by the end of the summer. That is in 8 weeks from now.
Subscribers to our premium blockchain investing service get one or two email alerts per week, and will be notified right away once we see a BUY alert. They also have access to our selection of 10 cryptocurrencies as well as 10 favorite blockchain stocks. Moreover, they will have access to a new and unique indicator in the world that nobody offers as published today in our latest exclusive alert. You can try it out today as well, at no risk.


