Investing
Haven
No Result
View All Result
Forecasting Global Markets
  • Login
  • 2023 Forecasts
  • Stocks
  • Commodities
  • Silver
  • Lithium
  • Crypto
  • Top AI Stocks →
  • Top Silver Stocks →
  • TOP ENERGY STOCKS →
  • Top Lithium Stocks →
  • CRYPTO SELECTION →
Investing
Haven
  • 2023 Forecasts
  • Stocks
  • Commodities
  • Silver
  • Lithium
  • Crypto
No Result
View All Result
InvestingHaven
No Result
View All Result

Ripple Price: Watch the Resolution of this Important Chart Pattern

by Taki Tsaklanos
June 07, 2018
in Super Growth
0
Tags: XRPXRPUSD
ripple xrp
Share on FacebookShare on Twitter

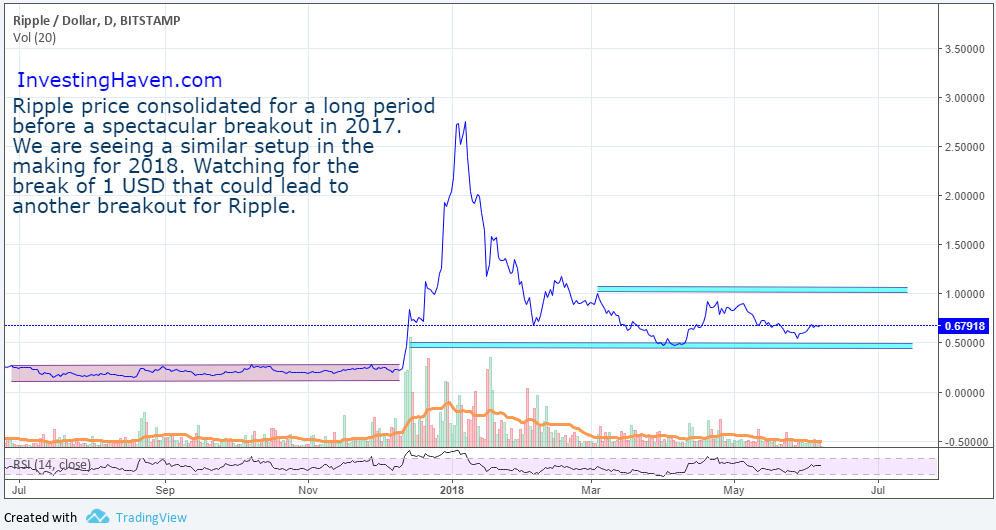
Ripple price consolidated for a long period and under performed for most of 2017 before a spectacular breakout where it outperformed Bitcoin and even Ethereum. The price action discouraged many investors looking for the quick wins in Crypto. But for those who were patient, the returns were worth the wait.

Note that we wrote this just one week after Ripple’s major peak, and we still feel very strong that this call is accurate and actual: Ripple’s Price Flash Crash After It Peaked

The story couldn’t be any clearer: After a major run, Ripple price reached the top of the ascending channel and retraced. It is to be expected that this important resistance will not be broken as of the first attempt.

At the moment of writing we are seeing a similar setup in the making for 2018. Ripple price chart shows that there is a pattern to the price movement and that’s what we will cover in our article today to try to understand what the next move will look like for Ripple.

An important pattern in Ripple’s price chart

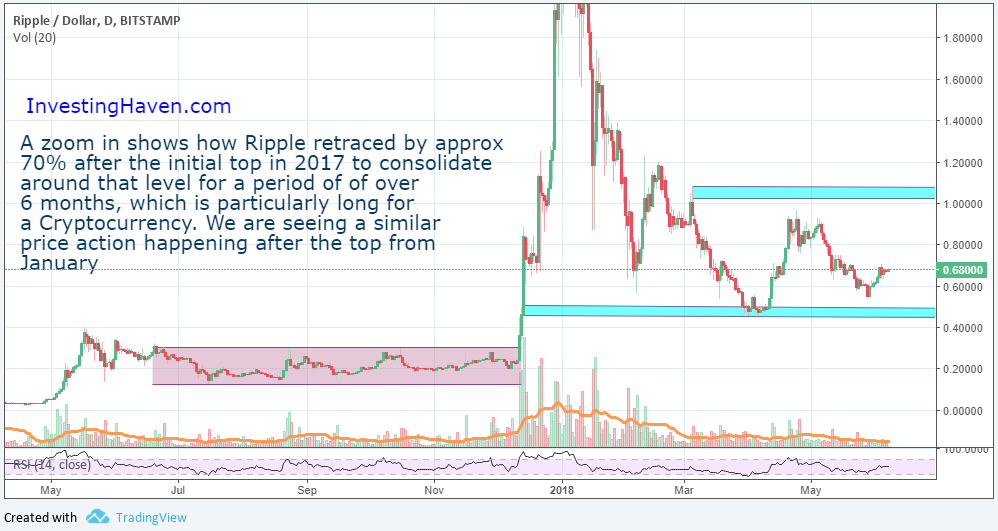
The pattern we are referring to is actually very clear on the chart: A breakout, a 75% retrace followed by a long consolidation period. The pattern is shown clearly in the the first chart and the details are clearer as we zoom in in the second chart below.

Note: this article contains charts and analysis that is only available to premium subscribers from InvestingHaven’s blockchain investing research. Subscribers have this type of analysis for all top cryptocurrencies and top blockchain stocks, as well as weekly updates and buy / sell alerts.

We will be watching for the break of 1 USD to the upside which could lead to another breakout for Ripple. This breakout needs to happen with a strong volume, otherwise, it might be a fake breakout. The other factor that will impact Ripple’s upcoming performance is Bitcoin’s price since it remains the leading indicator of market sentiment for Cryptocurrencies.

ripple price chart

What can investors expect in terms of price performance for Ripple? We believe a consolidation in the 0.50 USD to 1 USD is likely to continue till the sector recovers. The recovery will be signaled by Bitcoin breaking out above 12,000. Once that happens, a breakout above 1 USD for Ripple, paired with a strong volume will lead to higher prices for Ripple in 2018.

Ripple remains Bullish as long as it trades above 0.50 USD and we see the potential for a major breakout in 2018 similar to what happened in 2017. The longer the sideways movement the better as shown by the chart below.

From a fundamental perspective, Ripple’s adoption for pilots with different banks continues and that’s a very good sign for investors. Ripple is also being enhanced as the team published 2 whitepapers this year to improve the Cryptocurrency’s connectivity between different nodes as well as the verification of transactions which for sure will resonate with more banks and adopters.

Receive our weekly newsletter.

*We hate spam as you do.

premium service trade alerts   premium service trade alerts   premium service crypto teaser  
WARNING: InvestingHaven.com, our site, is not affiliated and has no connection whatsoever with Invest Haven Group on Invest-Haven.com or Investing-Haven.com. InvestingHaven.com did not have and will never have sales reps. Do not accept financial offers, certainly not by telephone, this is why >>
Taki Tsaklanos

Taki Tsaklanos

Taki has +15 years of experience in global markets. His methodology is unique and effective, yet easy to understand; it is based on chart analysis combined with intermarket / fundamental / sentiment analysis. His work appeared on major financial outlets like FinancialSense, MarketWatch, ... Email: taki.tsaklanos@gmail.com. Twitter: twitter.com/investinghaven

Latest

stocks forecast

How To Know When The S&P 500 Confirms A Bullish Turning Point?

September 28, 2023
cryptocurrency forecast prediction

The Most Bullish Cryptocurrency Chart Setup Of October 2023

September 28, 2023
leading indicators

Will The S&P 500 Find Support At Its 200 Day Moving Average?

September 24, 2023
uranium stocks

Is The Breakout In The Uranium Market Confirmed?

September 24, 2023

Connect with InvestingHaven

Receive top notch forecasts for free.

*We hate spam as you do.

Categories

  • 2023 Forecasts
  • Stocks
  • Commodities
  • Silver
  • Lithium
  • Crypto

Site Navigation

  • RSS Feed
  • About us
  • Mission 2026
  • Sitemap
  • Privacy & Disclaimer
  • Terms of Service
  • InvestingHaven vs. Invest-Haven
  • Contact Us
Investing
Haven

Top notch forecasting with gold price forecast, many stock predictions, cryptocurrency charts. Many investing tips and crypto market analysis.

Copyright © 2023 InvestingHaven

No Result
View All Result
  • 2023 Forecasts
  • Stock market
  • AI Stocks
  • Alternative Energy
  • Lithium Articles
  • Lithium Stocks
  • Silver Articles
  • Silver Stocks
  • Crypto Articles
  • Premium Crypto Research
  • Premium Services & MyAccount

Copyright © 2023 InvestingHaven

Login to your account below

Forgotten Password?

Fill the forms bellow to register

All fields are required. Log In

Retrieve your password

Please enter your username or email address to reset your password.

Log In

    InvestingHaven.com honours your privacy. Read our Privacy Policy