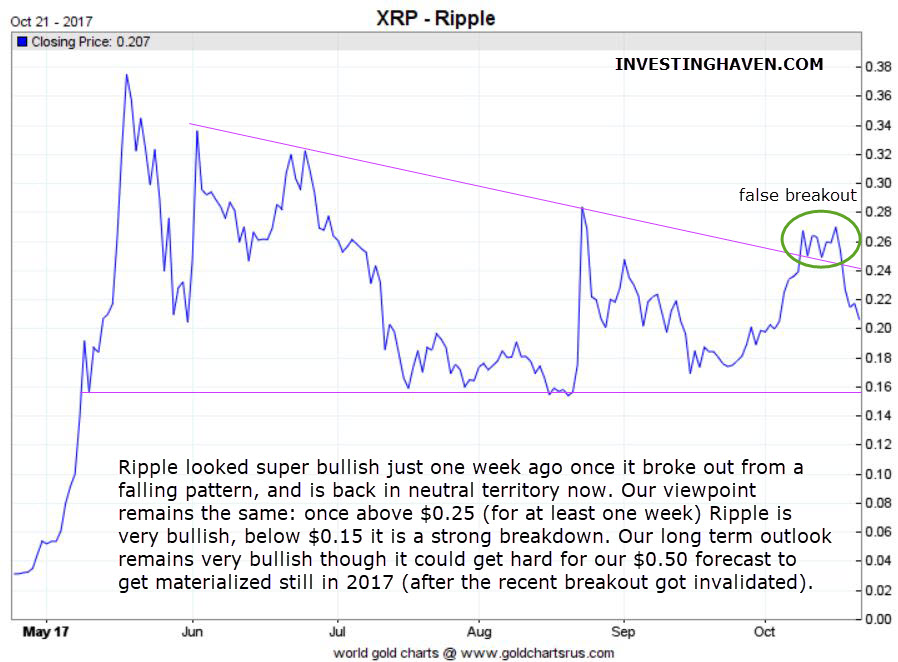
The price of Ripple lost 30 percent in just one week. Although that is impressive for a regular investor, it is ‘more of the same’ in crypto land. Cryptocurrencies are extremely volatile in nature.
We were about to become very excited a week ago when Ripple’s price was very close to a mega breakout. As noted before Ripple has this super critical price level of 0.26 USD which basically is the breakout point.
Interestingly, Ripple started to break out a week ago: its price broke above 0.26 USD, and rose to $0.30 in two days. That was a clear breakout, without any doubt, as seen on the first chart below.
However, the price came down this week, and is now back in its consolidation pattern. Note that this is a neutral pattern, it’s not bullish nor bearish. A consolidation is a great thing, at least long term. It is a sign of accumulation, and is most often the basis for a bullish trend at a later point in the future.
Even if the price of Ripple is back in neutral territory at this point we we still remain very bullish long term. The price of Ripple will or will not rise above 0.50 USD in 2017 (which was our 2017 forecast), we do not know for sure at this point, given the false breakout (it would have been the trigger to rise to our 2017 price target). If Ripple does not get there in 2017, it will most likely in 2018.
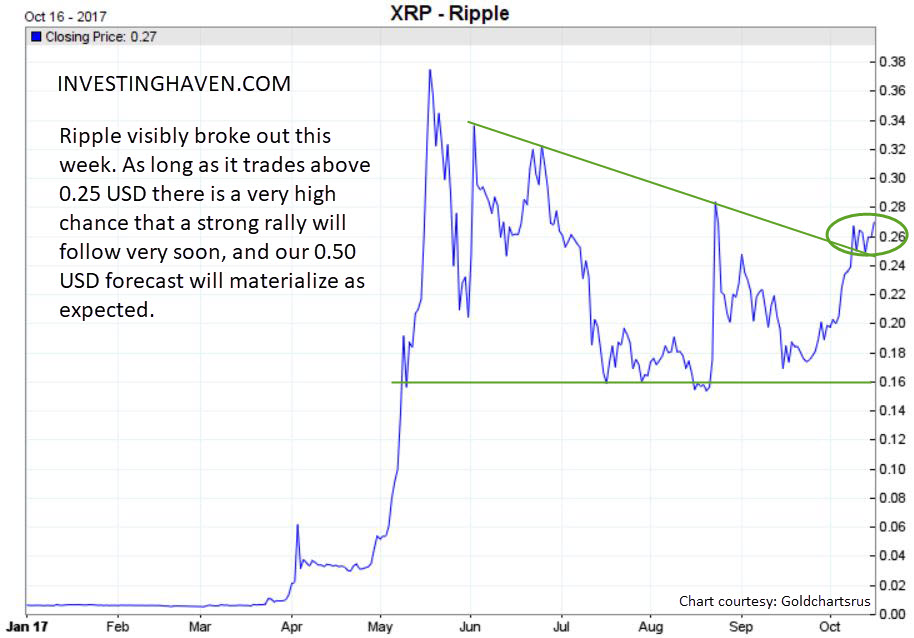
The second chart is just to illustrate how fast things can change in crypto land. A couple of days after the breakout we created below chart. We could not write an article to accompany the article … and one day later Ripple was falling … two days later it was back in its current pattern. It really is that fast that things can change in cryptocurrencies.
The annotations on below chart are invalid in the meantime!
Ed. note: InvestingHaven is the first in the world to offer a Blockchain Investing Research service, subscribe now to get the top 3 to 5 tokens per year and our proprietary risk/reward score for all blockchain stocks trading on public exchanges.


