Investing
Haven
No Result
View All Result
Saturday, January 23, 2021
  • Login
  • Premium Services & Login
  • 2021 Forecasts
  • Commodities & Gold
  • Stocks
  • Crypto
  • Mission 2026
Crypto investing >>
Investing
Haven
  • Premium Services & Login
  • 2021 Forecasts
  • Commodities & Gold
  • Stocks
  • Crypto
  • Mission 2026
No Result
View All Result
Investing Haven
No Result
View All Result
Home Markets & Stocks

2 Must-See Stock Market Charts For Q1 2019

by Taki Tsaklanos
January 17, 2019
in Markets & Stocks
0
Tags: XLFXLV
2.1k
VIEWS
Share on FacebookShare on Twitter

Global markets are at a major pivot point. We made this point recently in our 5 must-see charts on a global market crash as well as our stock market crash 2019 in 12 charts. All the leading indicators we track are available in those 2 articles. On top of this we feature in this article 2 stock market charts which will be crucial in 2019. One is the financial sector which may turn stock markets bullish again. The other one is the health sector which, provided stocks become bullish, will have quite some winners.

We do not only feature a stock chart because we believe it should be traded. More importantly, we feature stock charts, or sector charts, because of their meaning within this universe of financial markets.

That’s what intermarket dynamics are all about as explained in our 100 investing tips.

Markets move in relation to each other, they do not move in a vacuum. Capital flows from one market to another market, considering that cash is also a market (any currency). This flow of capital can be identified by thoroughly analyzing chart patterns and trends in a handful of leading assets. They are primarily treasuries, currencies, leading stock market indices, gold, crude oil.

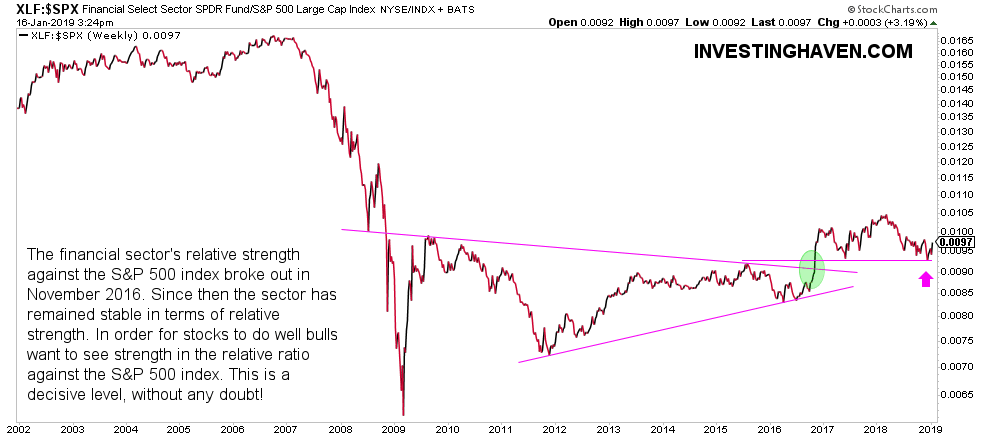
That’s how to interpret the financial sector chart we feature in this article.

Specifically, the financial sector relative strength against the S&P 500 index is an important indicator according to us. Not only for the financial sector, but, more importantly, for global stock markets.

The financial sector relative strength against the S&P 500 index broke out in November 2016. Since then the sector has remained stable in terms of relative strength. In order for stocks to do well bulls want to see strength in the relative ratio against the S&P 500 index. This is a decisive level, without any doubt!

stock market chart financials

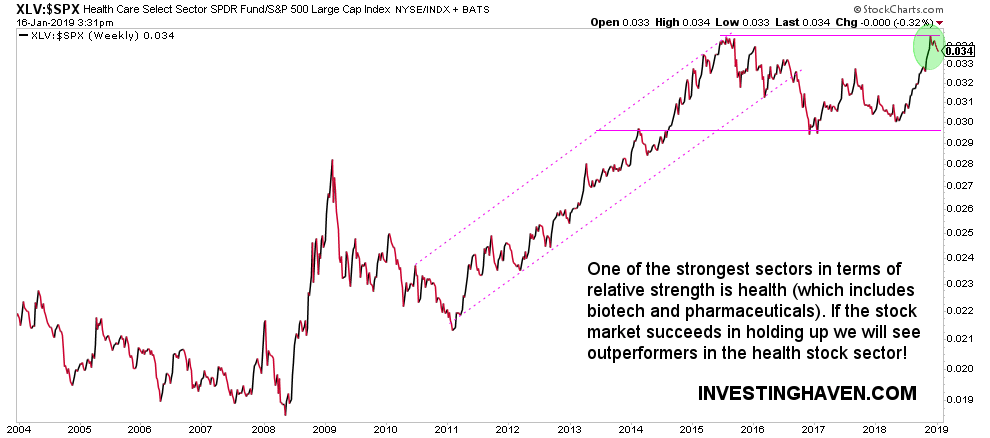
The second must-see stock chart is not a leading indicator but probably an outperformer, if and once stock markets become bullish again.

In other words this is a sector that should be looked at to identify future winners, the type of stocks you want to hold if we know for sure that the stock bull market continues.

One of the strongest sectors in terms of relative strength is health. If the stock market succeeds in holding up we will see outperformers in the health stock sector!

The health sector includes biotech and pharmaceuticals. We believe this is one of the places to look for outperforming stocks once we get a confirmation that stock markets won’t go much lower from here.

stock market chart health

  premium service trade alerts   premium service trade alerts   premium service crypto teaser  
Taki Tsaklanos

Taki Tsaklanos

Taki has +15 years of experience in global markets. His methodology is unique and effective, yet easy to understand; it is based on chart analysis combined with intermarket / fundamental / sentiment analysis. His work appeared on major financial outlets like FinancialSense, MarketWatch, ... Email: taki.tsaklanos@gmail.com. Twitter: twitter.com/investinghaven

  • Trending
  • Comments
  • Latest
silver prices

A Silver Price Forecast For 2021 *Silver 30 USD Underway*

January 2, 2021
gold price

A Gold Price Forecast For 2021 *Gold 2200 USD Underway*

January 2, 2021
dow jones

Dow Jones Long Term Chart on 20 Years *10 Must See Charts*

October 26, 2020
dow jones

A Dow Jones Forecast For 2021 *New All Time Highs*

January 2, 2021
bulls bears

S&P 500: Is This A Medium Term Topping Pattern?

0

Protected: [Emerging Markets/Gold/Silver] Heads up Template

0

Protected: [SPY] Heads up Template

0

Protected: [GOLD] Buy Alert Template

0
bulls bears

S&P 500: Is This A Medium Term Topping Pattern?

January 17, 2021
bitcoin

Bitcoin: Major Top Already Hit Or Parabolic Move Underway?

January 17, 2021
risk

Global Stock Leading Indicator: A Not So Promising Setup For February of 2021

January 17, 2021
us dollar

Dollar Ready To Create Havoc With Markets?

January 17, 2021

Connect with InvestingHaven

Receive top notch forecasts for free.

*We hate spam as you do.

Categories

  • Premium Services & Login
  • 2021 Forecasts
  • Commodities & Gold
  • Stocks
  • Crypto
  • Mission 2026

Site Navigation

  • RSS Feed
  • About us
  • Sitemap
  • Privacy & Disclaimer
  • Terms of Service
  • Contact Us
Investing
Haven

Top notch forecasting with gold price forecast, many stock predictions, cryptocurrency charts. Many investing tips and crypto market analysis.

Copyright © 2021 Investing Haven

No Result
View All Result
  • Premium Services & Login
  • Premium Investing Service
  • Premium Trading Service
  • Premium Crypto Service
  • 2021 Forecasts
  • Markets & Stocks
  • Commodities & Gold
  • Crypto Markets
  • Mission 2026

Copyright © 2021 Investing Haven

Login to your account below

Forgotten Password?

Fill the forms bellow to register

All fields are required. Log In

Retrieve your password

Please enter your username or email address to reset your password.

Log In