Investing Haven
No Result
View All Result
Gold Silver Investing >>
CRYPTO INVESTING >>
  • 2025 Forecasts
    • 10 market predictions
    • Dow Jones forecast
    • S&P 500 forecast 2025
    • Nasdaq prediction 2025
    • Best altcoins to buy
    • Best crypto to buy now
    • Which crypto will explode
    • 15 crypto forecasts 2025
    • Which precious metal to buy
  • Silver
    • Silver prediction 2025 – 2030
    • Will silver exceed $30?
    • When will silver hit $50?
    • Can silver hit $100?
    • Silver shortage
    • 50-year silver chart
    • Silver bullish reversal
    • Silver seasonality charts
    • How to invest in silver
  • Gold
    • Gold prediction 2025 – 2030
    • Will gold set new ATH?
    • Will gold hit $3,000?
    • Can gold hit $10,000?
    • Gold chart 10 years
    • Gold chart 50 years
    • Gold chart 100 years
    • Gold silver ratio
    • Gold seasonality charts
  • Commodities
    • Coffee forecasts
    • Sugar forecasts
    • Nickel forecasts
    • Lithium investing
  • Crypto forecasts
    • BTC prediction 2025 – 2030
    • ETH prediction 2025 – 2030
    • SOL prediction 2025 – 2030
    • XRP prediction 2025 – 2030
    • XLM prediction 2025 – 2030
    • BNB prediction 2025 – 2030
    • ADA prediction 2025 – 2030
    • AVAX prediction 2025 – 2030
    • KAS prediction 2025 – 2030
    • NEAR prediction 2025 – 2030
    • BCH prediction 2025 – 2030
    • LINK prediction 2025 – 2030
    • DOT prediction 2025 – 2030
    • SUI prediction 2025 – 2030
    • ICP prediction 2025 – 2030
    • LTC prediction 2025 – 2026
    • STX prediction 2025 – 2030
    • DOGE prediction 2025 – 2030
    • SHIB prediction 2025 – 2030
    • PEPE prediction 2025 – 2030
    • FLOKI prediction 2025 – 2030
    • WIF prediction 2025 – 2030
    • ONDO prediction 2025 – 2030
  • News
    • Crypto news
    • Commodities
  • Login
Investing Haven
No Result
View All Result

Home » Markets & Stocks » 3 Must See Charts On China’s Stock Market Selloff in 2018

3 Must See Charts On China’s Stock Market Selloff in 2018

Taki Tsaklanos by Taki Tsaklanos
February 2, 2019
in Markets & Stocks
crash stocks
2.2k
VIEWS
Share on FacebookShare on Twitter

China’s stock market selloff in 2018 is serious. The index lost 25% in 2018, large cap stocks in China also lost 25% and China internet stocks lost 22% in 3 weeks time. InvestingHaven takes a step back from the frenziness, and zooms out to stay focused on the longer term trends. This article contains 3 must see charts on China’s stock market selloff in 2018.

We take a classic top-down approach in looking at China’s stock market selloff. First, China’s index SSEC on the monthly chart on 20 years, followed by the large cap stock index FXI ETF (FXI) on the monthly, and finally the internet stocks ETF KWEB (KWEB) on the weekly.

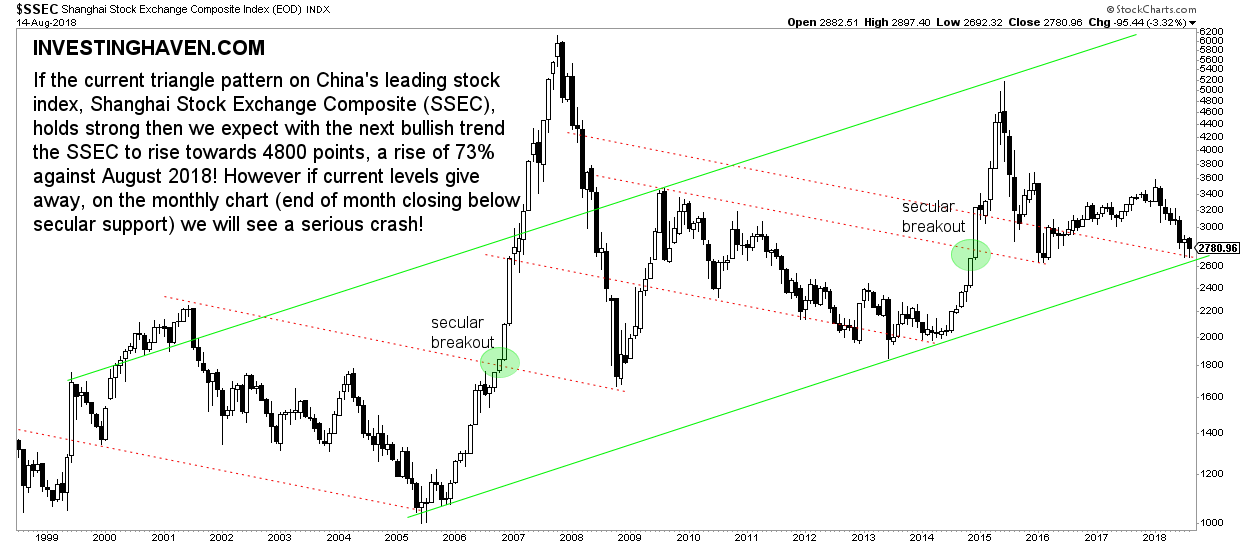
China Stock Market Selloff Of 2018: Chart #1 SSEC monthly

The monthly chart of SSEC (SSEC) was as discussed many times before on this blog: China Stock Market At Make-Or-Break Level (July 2018) and China Stock Market Has 10 Pct More Downside, Major Buy Opportunity Setting Up (June 2018).

In previous articles we identified current levels as great entry points.

What makes today’s situation somehow stressful is the unknown factor of Turkey’s stock market crash. It’s a wildcard, led by Turkish PM. If that situation gets worse we can see a true crash of epic proportions, not only in Turkey but also in other emerging markets, primarily China.

That is because China trades at secular support. The monthly chart speaks for itself. In no way do stock market bulls want to see the SSEC close below 2700 points at the end of the coming months, starting August 2018!

It may not be visible on this chart but the lowest support line on the first chart goes back almost 30 years. It really is an important trend.

In case the stock market panic eases, and Turkey gets its act together with its Lira, then China is at a very enticing entry point, in other words a BUY signal with lots of upside potential in 2018 and beyond.

must see chart China stock market selloff 2018

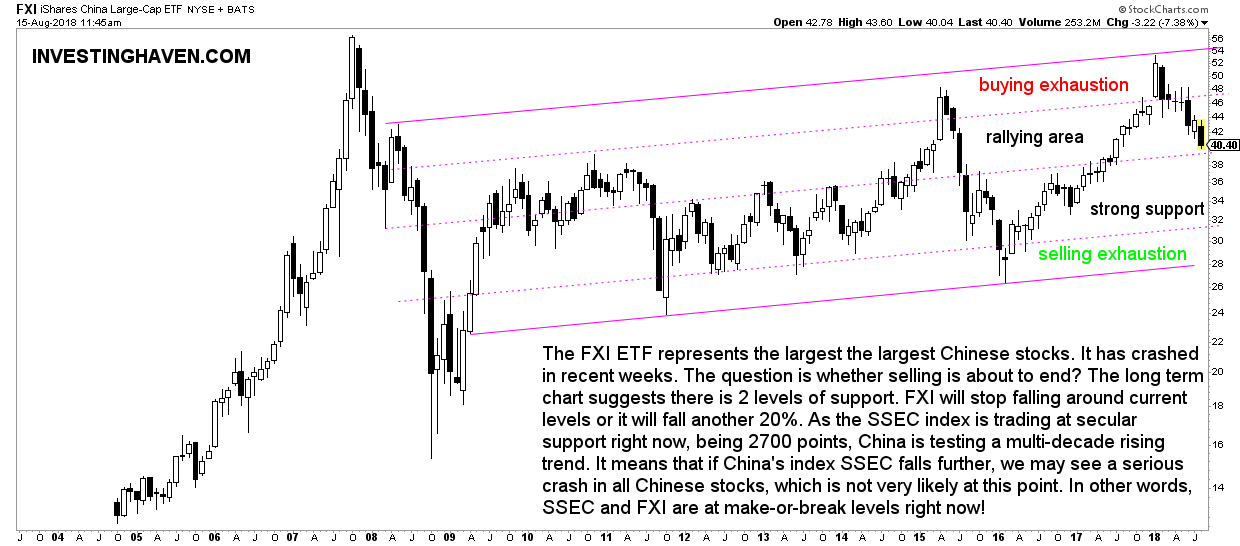
China Stock Market Selloff Of 2018: Chart #2 FXI monthly

The largest stocks in China are represented by the FXI ETF.

Its chart is truly beautiful, a clear trend that has respected its pattern.

It also shows that large cap stocks in China were a very interesting place to be since 2016, as said many times on our blog.

China’s stock market selloff in 2018 is also visible on the FXI ETF monthly chart. Note how the 25% decline since January 2018 brought the FXI to an important support area. We tend to believe that current levels will provide support. If not, the support that is visible on this chart is a wide area from 32 to 39 points.

Provided the SSEC shown above holds strong we are looking at an amazing buy opportunity in FXI ETF. However, in case SSEC gives away then FXI will fall lower.

must see chart China stock market selloff 2018

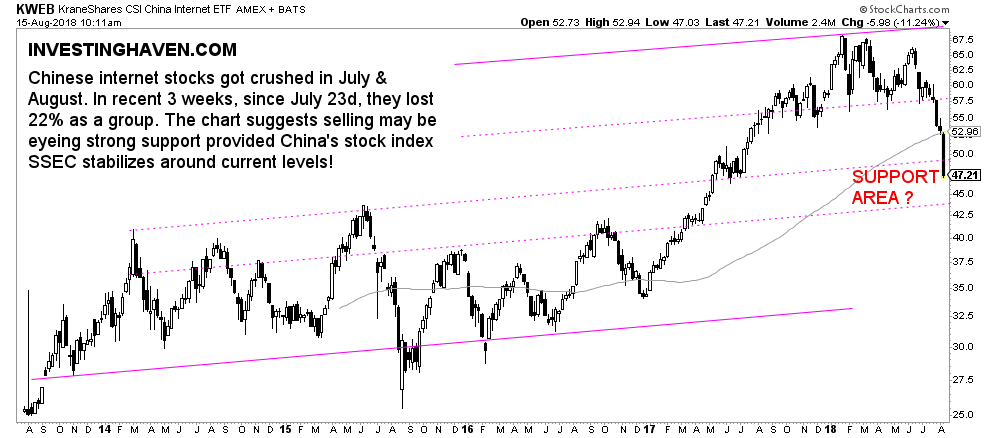
China Stock Market Selloff Of 2018: Chart #3 KWEB weekly

The last chart showing China’s stock market selloff in 2018 is China’s internet stocks. It is KWEB ETF that represents China internet stocks.

Note how this selloff accelerated 3 weeks ago, specifically on July 23d, with a 22% decline in a matter of 3 weeks.

Visibly, KWEB has entered a strong support area. Although there is some downside to the 43 level, which is just 7% below current levels, we strongly believe this selloff is about to decelerate.

must see chart China stock market selloff 2018

10-YEAR ANNIVERSARY OFFER: InvestingHaven.com celebrates 10 years. Temporarily, you can enjoy a discount on our premium gold/silver and crypto reports. Or you can become a VIP member. Go to our anniversary deals >>
Receive our weekly newsletter.

premium service SP-500 premium service trade alerts premium service crypto teaser 

No related posts.

Tags: FXIKWEBSSEC
Taki Tsaklanos

Taki Tsaklanos

Taki has +15 years of experience in global markets. He is passionate about forecasting markets - he calls it THE ART OF FORECASTING. His analysis methodology is unique and effective, yet easy to understand; it is based on chart analysis combined with intermarket / fundamental / sentiment analysis. His work appeared on major financial outlets like FinancialSense, MarketWatch,Twitter: twitter.com/investinghaven

Connect with InvestingHaven

Receive top notch forecasts for free.

*We hate spam as you do.

Site Navigation

  • RSS Feed
  • About us
  • Advertising
  • Sponsored Content Policy
  • Mission 2026
  • Sitemap
  • Privacy & Disclaimer
  • Terms of Service
  • Contact Us
investing haven logo

Precious metals market analysis including gold and silver price predictions. Crypto market analysis including highly accurate BTC ETH SOL XRP forecasts.

Copyright © 2025 InvestingHaven

Login to your account below

Forgotten Password?

Fill the forms bellow to register

All fields are required. Log In

Retrieve your password

Please enter your username or email address to reset your password.

Log In

Receive top notch forecasts for free.

*We hate spam as you do.

No Result
View All Result
  • News
  • 2025 Forecasts
    • 10 market predictions
    • Dow Jones forecast 2025
    • S&P 500 forecast 2025
    • Nasdaq prediction 2025
    • Best crypto to buy now
    • Which crypto will explode
    • Best altcoins to buy
    • 15 crypto forecasts 2025
    • Which precious metal to buy
  • Silver articles
    • Silver prediction 2025 – 2030
    • Will silver exceed $30?
    • When will silver hit $50?
    • Can silver hit $100?
    • Silver shortage
    • 50-year silver chart
    • Silver bullish reversal
    • Silver seasonality charts
    • How to invest in silver
  • Gold
    • Gold prediction 2025 – 2030
    • Will gold set new ATH?
    • Will gold hit $3,000?
    • Can gold hit $10,000?
    • Gold chart 10 years
    • Gold chart 50 years
    • Gold chart 100 years
    • Gold silver ratio
    • Gold seasonality charts
  • Commodities
    • Sugar forecasts
    • Coffee forecasts
    • Nickel forecasts
    • Lithium investing
  • Crypto news
  • Crypto forecasts
    • BTC prediction 2025 – 2030
    • ETH prediction 2025 – 2030
    • SOL prediction 2025 – 2030
    • XRP prediction 2025 – 2030
    • XLM prediction 2025 – 2030
    • BNB prediction 2025 – 2030
    • ADA prediction 2025 – 2030
    • AVAX prediction 2025 – 2030
    • KAS prediction 2025 – 2030
    • NEAR prediction 2025 – 2030
    • BCH prediction 2025 – 2030
    • LINK prediction 2025 – 2030
    • DOT prediction 2025 – 2030
    • SUI prediction 2025 – 2030
    • ICP prediction 2025 – 2030
    • LTC prediction 2025 – 2026
    • STX prediction 2025 – 2030
    • DOGE prediction 2025 – 2030
    • SHIB prediction 2025 – 2030
    • PEPE prediction 2025 – 2030
    • FLOKI prediction 2025 – 2030
    • WIF prediction 2025 – 2030
    • ONDO prediction 2025 – 2030
  • Premium Crypto Alerts
  • Premium services

Copyright © 2025 InvestingHaven