Investing Haven
No Result
View All Result
Gold Silver Investing >>
CRYPTO INVESTING >>
  • 2025 Forecasts
    • 10 market predictions
    • Dow Jones forecast
    • S&P 500 forecast 2025
    • Nasdaq prediction 2025
    • Best altcoins to buy
    • Best crypto to buy now
    • Which crypto will explode
    • 15 crypto forecasts 2025
    • Which precious metal to buy
  • Silver
    • Silver prediction 2025 – 2030
    • Will silver exceed $30?
    • When will silver hit $50?
    • Can silver hit $100?
    • Silver shortage
    • 50-year silver chart
    • Silver bullish reversal
    • Silver seasonality charts
    • How to invest in silver
  • Gold
    • Gold prediction 2025 – 2030
    • Will gold set new ATH?
    • Will gold hit $3,000?
    • Can gold hit $10,000?
    • Gold chart 10 years
    • Gold chart 50 years
    • Gold chart 100 years
    • Gold silver ratio
    • Gold seasonality charts
  • Commodities
    • Coffee forecasts
    • Sugar forecasts
    • Nickel forecasts
    • Lithium investing
  • Crypto forecasts
    • BTC prediction 2025 – 2030
    • ETH prediction 2025 – 2030
    • SOL prediction 2025 – 2030
    • XRP prediction 2025 – 2030
    • XLM prediction 2025 – 2030
    • BNB prediction 2025 – 2030
    • ADA prediction 2025 – 2030
    • AVAX prediction 2025 – 2030
    • KAS prediction 2025 – 2030
    • NEAR prediction 2025 – 2030
    • BCH prediction 2025 – 2030
    • LINK prediction 2025 – 2030
    • DOT prediction 2025 – 2030
    • SUI prediction 2025 – 2030
    • ICP prediction 2025 – 2030
    • LTC prediction 2025 – 2026
    • STX prediction 2025 – 2030
    • DOGE prediction 2025 – 2030
    • SHIB prediction 2025 – 2030
    • PEPE prediction 2025 – 2030
    • FLOKI prediction 2025 – 2030
    • WIF prediction 2025 – 2030
    • ONDO prediction 2025 – 2030
  • News
    • Crypto news
    • Commodities
  • Login
Investing Haven
No Result
View All Result

Home » Markets & Stocks » Decoding The VIX: Forecasting The Start of The 2023 Bull Market

Decoding The VIX: Forecasting The Start of The 2023 Bull Market

Taki T. by Taki T.
November 28, 2023
in Markets & Stocks
bull market bear market
1.9k
VIEWS
Share on FacebookShare on Twitter

The stock market can be a labyrinth of indicators and signals, each providing valuable insights into the overall sentiment and potential market movements. One such indicator is the VIX, commonly known as the “Fear Index,” which measures market volatility. In this blog post, we will explore a fascinating analysis of the VIX chart over 12 years, as featured in our (no) stock market crash 2023 prediction published in November last year and updated today, focusing on a critical breakdown that marked the start of a new bull market.

We examine the sequence of events, the resistance encountered, and the implications for investors in navigating the market’s twists and turns in 2023.

Unraveling the VIX Chart

The VIX chart serves as a barometer of market volatility and investor sentiment. By studying its patterns and identifying significant events, we can gain valuable insights into market trends and potential turning points. Let’s dive into the details of the breakdown that occurred on October 13th and the subsequent developments that shaped the outlook for a new bull market.

The October 13th Breakdown

On October 13th, a significant event took place in the stock market as the S&P 500 Index (SPX) opened below 3500 points. This event triggered a wave of bearish sentiment, with many convinced that a crash was imminent. Interestingly, this pivotal moment coincided with a breakdown in the structure of the VIX. As investors turned bearish, the VIX started breaking down, signaling a potential shift in market dynamics.

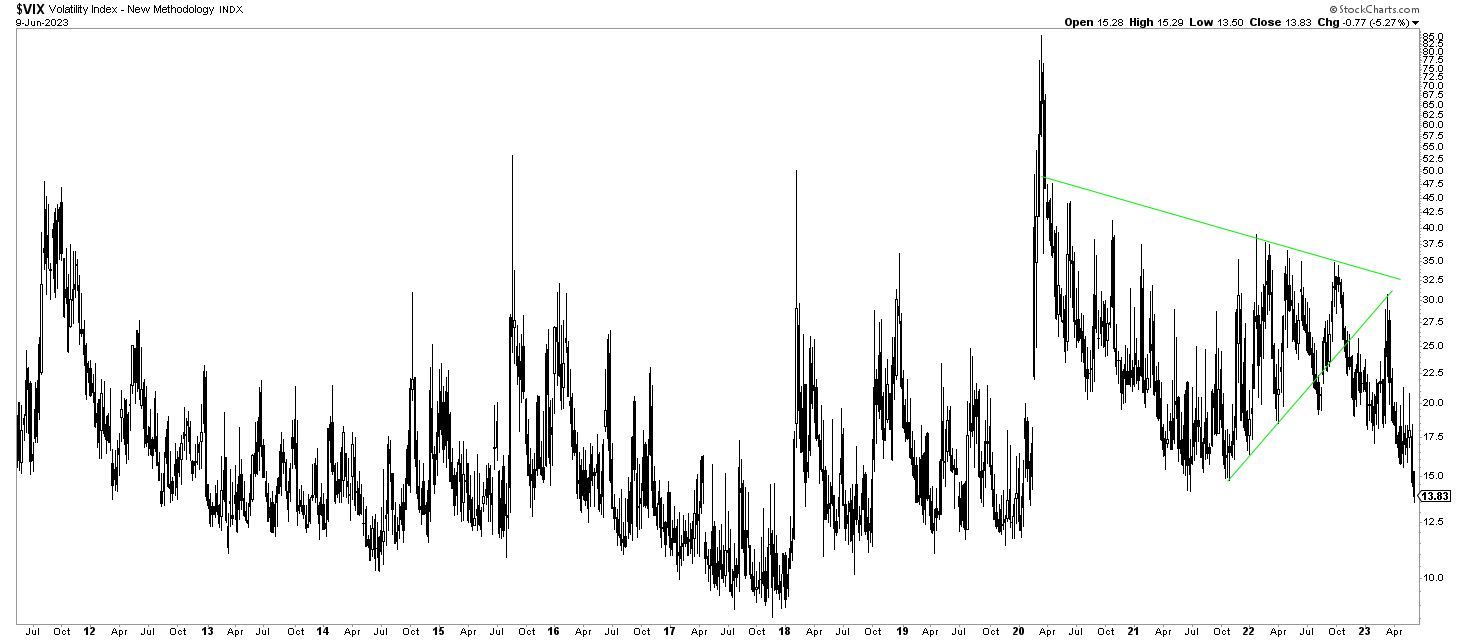
The Rising Trendline as Resistance

Following the breakdown, the VIX embarked on a journey that revealed crucial resistance levels. In March 2023, the VIX experienced a spike, reaching the rising trendline that acted as a formidable barrier. This trendline, drawn from previous peaks, held true to its nature by resisting the VIX’s ascent. The encounter with this resistance further solidified the notion that a new bull market had emerged.

A Bull Market in the Making

The breakdown in the VIX’s structure on October 13th marked the starting point of a new bull market. Despite “bumps on the road,” such as waves of selling and volatility spikes, the long-term structure of the VIX chart suggests that the bull market will continue to dominate in 2023. This observation carries significant implications for investors seeking to navigate the market’s ups and downs with a strategic approach.

The Power of Market Sentiment

The breakdown in the VIX’s structure, accompanied by a bearish sentiment among investors, highlights the power of market sentiment and the need for careful analysis. Investor psychology plays a crucial role in market movements, and recognizing shifts in sentiment can help investors anticipate potential market trends.

Navigating the Road Ahead

As the VIX continues to fluctuate, investors must remain vigilant and adaptable. The “bumps on the road” in the form of waves of selling and volatility spikes should be expected, but they should not derail the overall trajectory of the bull market. Investors should focus on long-term strategies, disciplined risk management, and a thorough understanding of the broader market dynamics.

Conclusion

The breakdown in the structure of the VIX on October 13th marked the beginning of a new bull market. Despite encountering resistance at the rising trendline, the VIX’s long-term structure indicates that the bull market will continue to dominate in 2023. Understanding the interplay between market sentiment, key events, and the VIX chart can provide investors with valuable insights into navigating the market’s twists and turns. By staying focused, disciplined, and informed, investors can position themselves to ride the waves of volatility.

VIX stock market crash 2023

10-YEAR ANNIVERSARY OFFER: InvestingHaven.com celebrates 10 years. Temporarily, you can enjoy a discount on our premium gold/silver and crypto reports. Or you can become a VIP member. Go to our anniversary deals >>
Receive our weekly newsletter.

premium service SP-500 premium service trade alerts premium service crypto teaser 

No related posts.

Tags: NASDAQNYSESPXVIX Volatility Index
Taki T.

Taki T.

Taki is a chart analyst who is passionate about unlocking unique insights out the chart. While the vast majority of analysts remain focused on price analysis, Taki starts with timeline analysis and adds price analysis to this. In doing so, he developed a unique methodology to find opportunities in financial markets, across assets and markets.

Connect with InvestingHaven

Receive top notch forecasts for free.

*We hate spam as you do.

Site Navigation

  • RSS Feed
  • About us
  • Advertising
  • Sponsored Content Policy
  • Mission 2026
  • Sitemap
  • Privacy & Disclaimer
  • Terms of Service
  • Contact Us
investing haven logo

Precious metals market analysis including gold and silver price predictions. Crypto market analysis including highly accurate BTC ETH SOL XRP forecasts.

Copyright © 2025 InvestingHaven

Login to your account below

Forgotten Password?

Fill the forms bellow to register

All fields are required. Log In

Retrieve your password

Please enter your username or email address to reset your password.

Log In

Receive top notch forecasts for free.

*We hate spam as you do.

No Result
View All Result
  • News
  • 2025 Forecasts
    • 10 market predictions
    • Dow Jones forecast 2025
    • S&P 500 forecast 2025
    • Nasdaq prediction 2025
    • Best crypto to buy now
    • Which crypto will explode
    • Best altcoins to buy
    • 15 crypto forecasts 2025
    • Which precious metal to buy
  • Silver articles
    • Silver prediction 2025 – 2030
    • Will silver exceed $30?
    • When will silver hit $50?
    • Can silver hit $100?
    • Silver shortage
    • 50-year silver chart
    • Silver bullish reversal
    • Silver seasonality charts
    • How to invest in silver
  • Gold
    • Gold prediction 2025 – 2030
    • Will gold set new ATH?
    • Will gold hit $3,000?
    • Can gold hit $10,000?
    • Gold chart 10 years
    • Gold chart 50 years
    • Gold chart 100 years
    • Gold silver ratio
    • Gold seasonality charts
  • Commodities
    • Sugar forecasts
    • Coffee forecasts
    • Nickel forecasts
    • Lithium investing
  • Crypto news
  • Crypto forecasts
    • BTC prediction 2025 – 2030
    • ETH prediction 2025 – 2030
    • SOL prediction 2025 – 2030
    • XRP prediction 2025 – 2030
    • XLM prediction 2025 – 2030
    • BNB prediction 2025 – 2030
    • ADA prediction 2025 – 2030
    • AVAX prediction 2025 – 2030
    • KAS prediction 2025 – 2030
    • NEAR prediction 2025 – 2030
    • BCH prediction 2025 – 2030
    • LINK prediction 2025 – 2030
    • DOT prediction 2025 – 2030
    • SUI prediction 2025 – 2030
    • ICP prediction 2025 – 2030
    • LTC prediction 2025 – 2026
    • STX prediction 2025 – 2030
    • DOGE prediction 2025 – 2030
    • SHIB prediction 2025 – 2030
    • PEPE prediction 2025 – 2030
    • FLOKI prediction 2025 – 2030
    • WIF prediction 2025 – 2030
    • ONDO prediction 2025 – 2030
  • Premium Crypto Alerts
  • Premium services

Copyright © 2025 InvestingHaven