
Global markets look shaky. Global stocks were volatile this year, and even U.S. stocks have followed their path lower in recent months. The million dollar question is whether this will result in a global market crash in 2019 or whether this is the end of a weak period. After publishing our Stock Market Crash In 2019 Brewing forecast we now look at global markets. Based on these 5 charts we want to make a point about the probability of a global market crash in 2019, and indicate which leading indicators to watch.
InvestingHaven’s recent analysis of the important and violet global market crashes recent decades shows that any important crash started with weakness in currency and credit markets.
In other words any attempt to forecast a global market crash starts with a thorough analysis of leading currency charts as well as yields.
More specifically we have to look for the long term chart patterns, and structural changes in patterns like reversals from secular support or resistance as well as breakouts or breakdowns from secular trends. This is also the focus in this article, and we do so based on 5 long term charts.
The short answer to our question whether we should prepare for a global market crash in 2019: no we do not see enough evidence as of now of a global market crash in 2019 but some of our leading indicators are visibly deteriorating. Their position do not suggest it will become as bad as in 2008 or 2000. Particularly 10-year Yields should be followed closely, especially the 3.0 level.
Below are the details behind our short answer.
Did a crash already start?
When it comes to stock markets one may argue that a market crash already started. Courtesy of Sentimentrader on Twitter the equity outflow reached its annually highest level in the last 15 years.
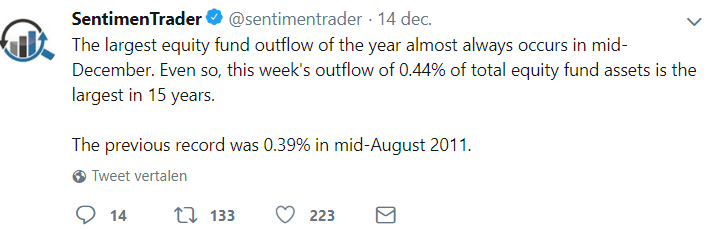
Does this mean that a market crash just started? Or does it mean that it is ending as this may suggest a peak?
The problem with these data points is that they are not suggesting the start nor the end of any trend. Also, they do not reveal where capital is flowing: if capital flows to Treasuries it will push rates seriously lower which, in its turn, may be very bearish for all markets, triggering a global market crash in 2019.
That’s why in this article we look at charts intermarket that suggest, first and foremost, where capital may be flowing to.
Our leading risk indicator
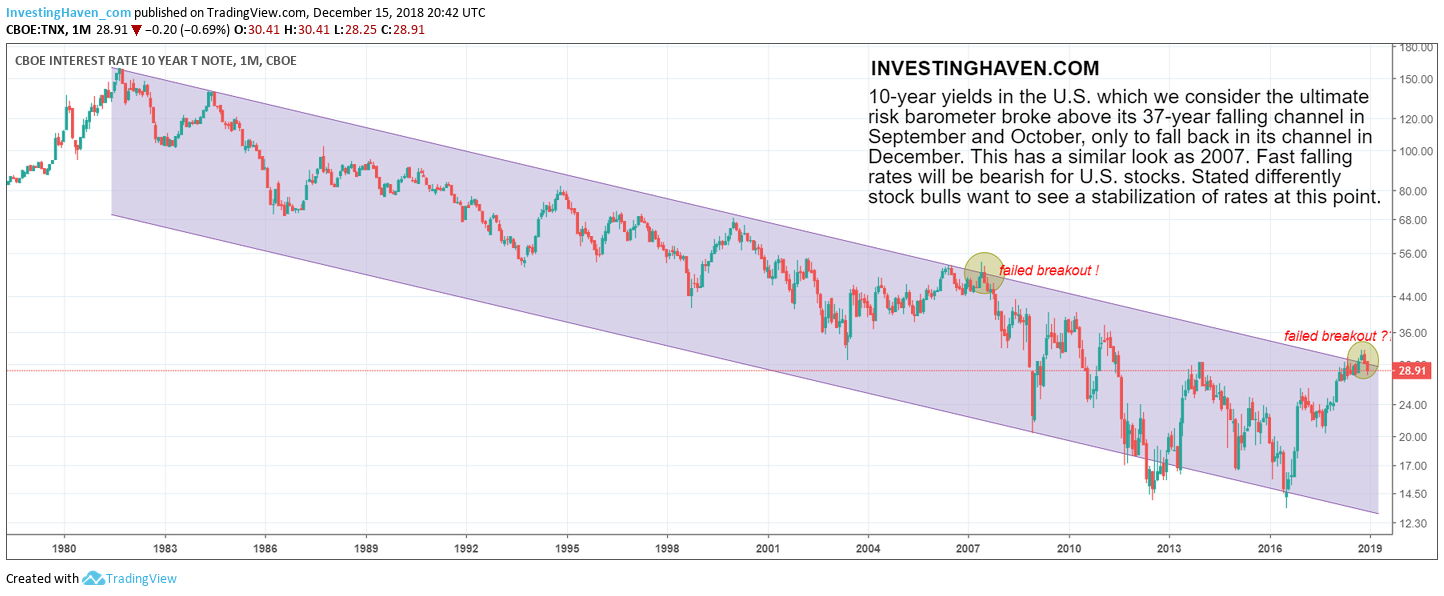
Our favorite leading risk indicator is 10-year Yields. When Yields go up it suggests risk-on sentiment among investors, primarily bullish for U.S. stocks. When Yields decline fast it suggests risk-off, and is bearish for U.S. stocks.
We have included a historic chart for 10-year Yields. That’s because it reveals the most dominant trend. Any trend change on this timeframe will have structural impact on all markets, globally.
On its 50 year chart we see a potentially very disruptive event: 10-year Yields tried to break out from a falling trend that started 4 decades ago. However, we also see that the fell back in their long term channel very recently.
More specifically, this breakout attempt started in August of this year, and we reported on this in great detail in Major Turning Point: End Of 40-Year Bull Market In Bonds. The breakout lasted for 3 months after which, a couple of weeks ago, Yields fell back in their channel.
This may become a failed breakout, and, if so, will have a similar looking as the failed breakout of 2007.
Let’s get things straight: if 10-year Yields remain below 3.00, and accelerate their decline, it might be the ultimate trigger for a global market crash of 2019. However, it has to be considered combined with the other leading indicators in this article.
In the meantime we also see an important event in 20 year bonds.
The bond market and Yields, both inversely correlated, have moved in one and the same direction in the last 37 years. We obviously look at the long run, and dominant secular trends, not short term moves. Over the last 4 decades bonds have gone up while Yields have come down.
As 10-year Yields are at a critical level right now, as explained above, we see that 20-year bonds successfully tested their support level. Note that the breakdown attempt from 2 months ago eventually failed, see the red circle annotated on below chart.
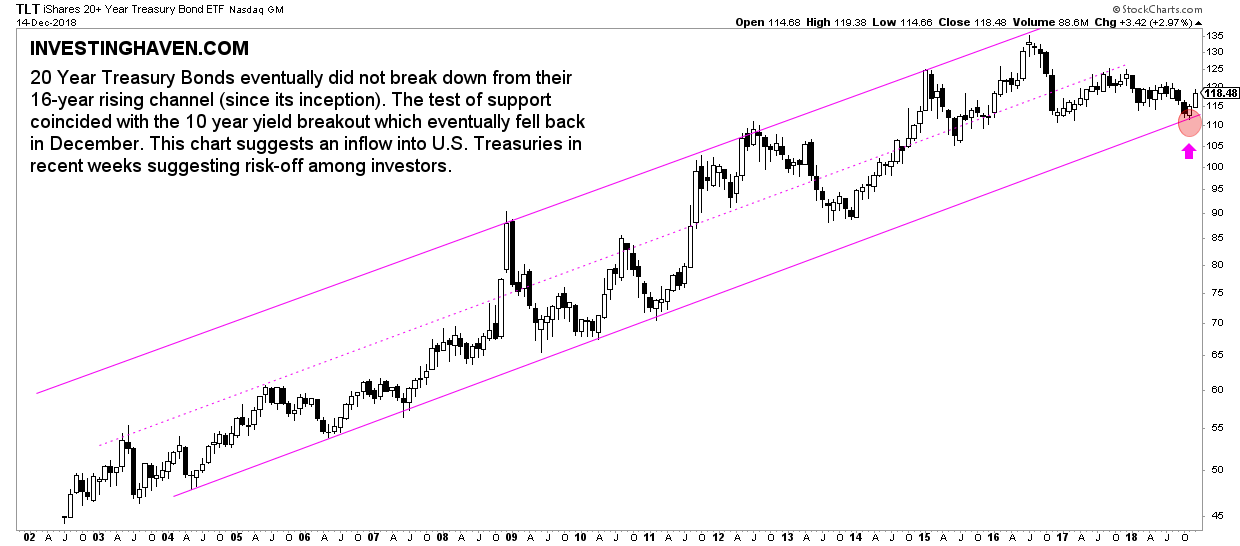
We watch closely 112 points in the TLT ETF as well as 3.00 in 10-year Yields, and specifically monthly closes above or below these levels.
Our leading currency indicator
As said currency and credit markets is where global market crashes always started.
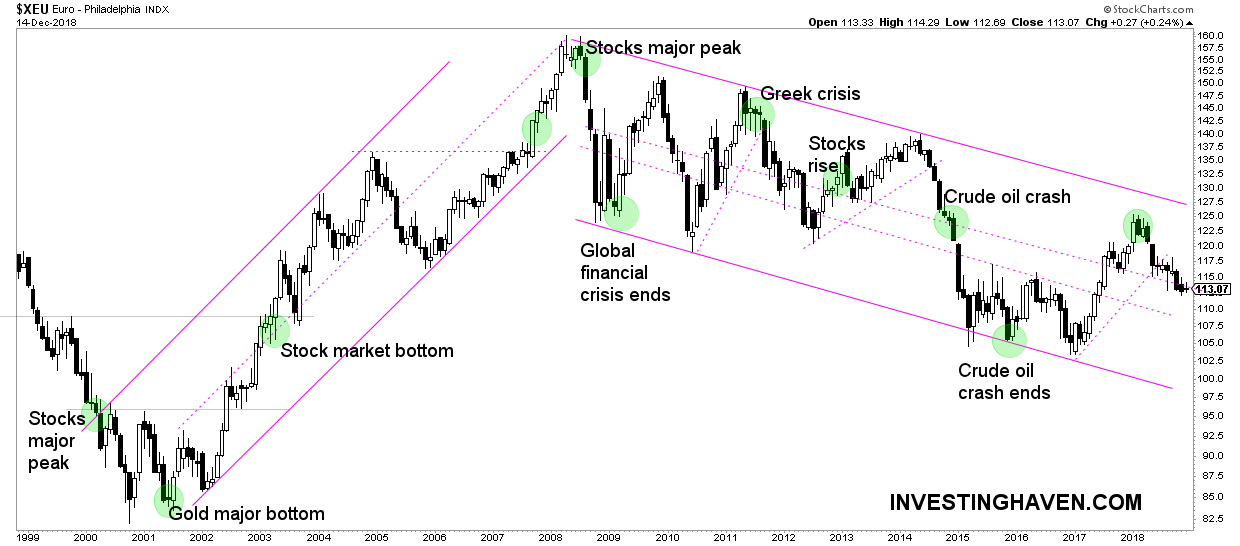
When it comes to currencies we have found most value in the Euro chart as it has clear and concise chart patterns.
We did annotate on the long term Euro chart embedded below all major market turning points, especially the ones that lead to significant market turmoil and stock market losses. The green dots indicate those major turning points.
As an illustration we look at the major stock market peak of 2008 which was somehow visible in the topping and consequent fast decline in the Euro. Similarly, the crude oil crash and Greek crisis violated breakdown levels.
When it comes to a possible pointer for a global market crash in 2019 there is not really a violent move in the Euro happening right now. Yes, the uptrend of 2016/2017 got violated early 2018 but it did not result in any aggressive move. At least, not as of yet.
In other words we will really get concerned once the Euro starts falling fast here. The opposite is true as well: resilience in the Euro will not trigger a global market crash in 2019.
Our leading stock indicators
Last but not least, when it comes to intermarket dynamics, we turn our attention to leading stock indicators. We look at the German DAX index as well as small caps in the U.S. with the Russell 2000 index.
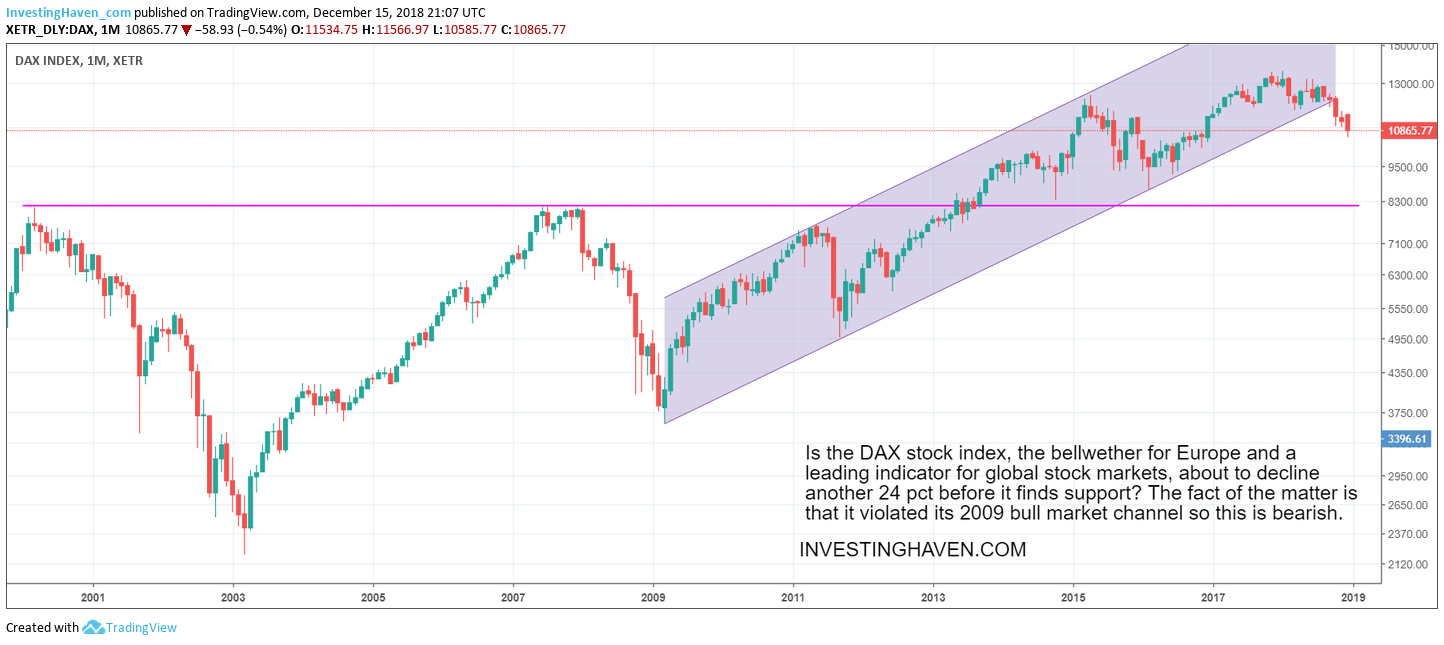
First, the DAX has a track record of signaling global stock market weakness ahead of other regions. It now shows a topping pattern that started early this year.
The DAX does not have lots of support around current levels. The first line of support, not really visible on this chart, is the 9000 to 9500 level which is some 12 to 15 pct below current levels. Ultimate support comes in at 8300 points which is another 24 pct decline.
Given the insights we get from the Russell 2000 below we would expect the first support levels in the DAX will hold. This means that as soon as the DAX comes in the 9500 area we can reasonably expect it to lead the end of the decline in global stock markets (not just German stocks).
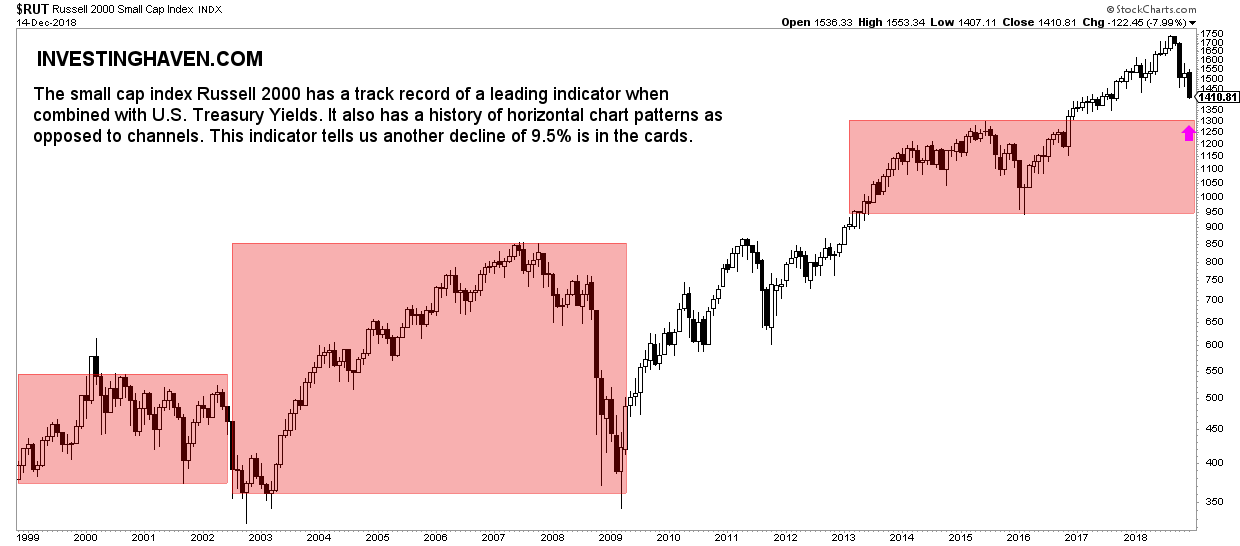
Second, U.S. small cap stocks have a track record of signaling major tops and bottoms. Note, for instance, how the 2009 bottom came in right at the 2002 lows, so it was a great leading indicator.
The U.S. small cap index has some 10 pct downside. We expect the 2014-2015 highs to provide sufficient support.
This lines up wit the first support line in the German DAX.
As a conclusion we see that stocks have downside but we primarily watch the Euro as well as 10-year Yields in the U.S. If both start falling fast it will be very bearish for global markets. However, if both hold up well, it will suggest the end of global market turmoil is near!


