In recent weeks, the topic of systemic risk has been on the minds of many investors. The question that many are asking is whether or not systemic risk is now contained. At InvestingHaven, we complemented our no market crash article and 2022 is not 2008 article with an additional indicator. In particular, we have been following specific data points and leading indicators to determine the answer to this question.
In early February, we predicted that a pullback was underway: Leading Indicators Confirming A Pullback Is Underway. Our analysis was based on leading indicators that were confirming this trend. We saw weakness in the market and believed that it was time to take a cautious approach to investing.
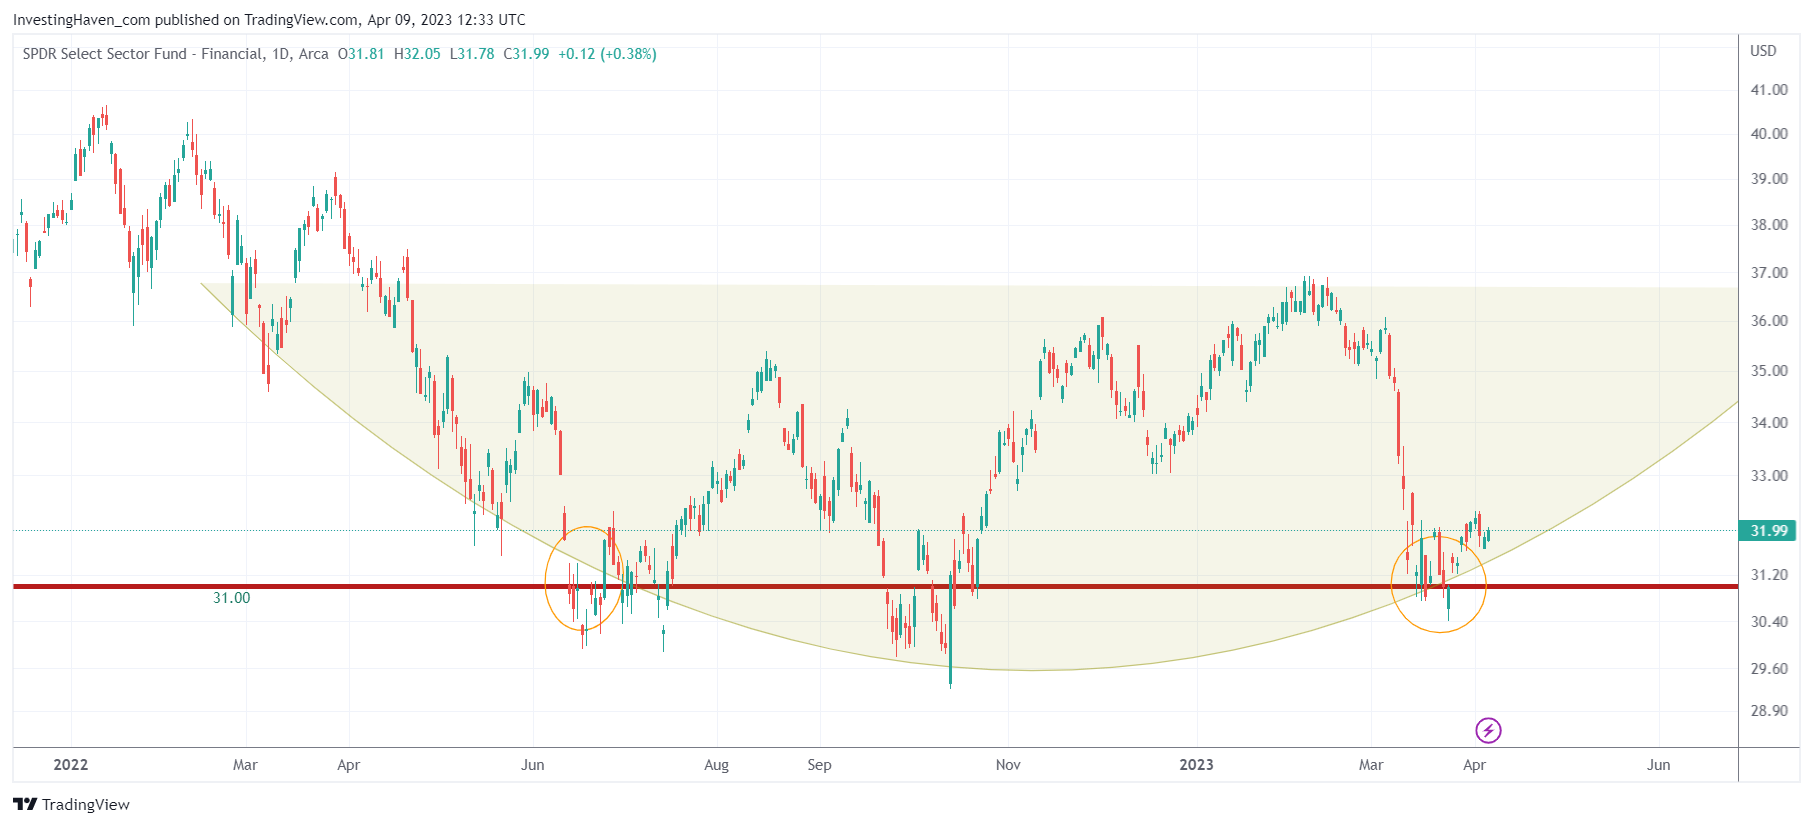
As the banking crisis peaked and doomsday articles flooded the media, we identified XLF with 31 points on its chart as the line in the sand. Readings below 31 points would exponentially increase the risk of a crash. Our analysis showed that the financial sector was at risk and that it was important to keep an eye on this sector to determine the health of the overall market. Source: Systemic Risk Indicator Now On The Edge.
Last week, we followed up with an up-to-date chart and two particularly interesting and highly relevant quotes from this article The Latest Message Of Our ‘Crash Indicator’:
What is particularly noteworthy about the XLF chart is the triple bottom that occurred at the 31-point level. A triple bottom is a bullish chart pattern that suggests that a support level has been established and that prices are likely to move higher in the future. In this case, the fact that 31 points held as support suggests that there is strong demand for financial stocks at this level.
This is the 2nd quote:
It’s also interesting to note that the 31-point level was thoroughly tested, and was on the verge of giving way, before the Federal Reserve stepped in and provided unlimited funds to the banking sector. This intervention helped to stabilize the financial system and prevent a crisis, and also provided a boost to the stock market as a whole.
Right now, we can say that the systemic risk indicator is improving. It continues to trade within the 18-month rounded pattern. The more orderly the move within the rounded pattern, the higher the confidence about its outcome. This means that while there is still some risk, it is not as significant as it was earlier this year.
So, is systemic risk now contained? The answer is not a straightforward one. While there is evidence to suggest that the risk is improving, there are still factors that could contribute to a potential crash. The global economy is still recovering from the pandemic, and there are concerns about inflation and supply chain disruptions. Also, geopolitical tensions and natural disasters could also impact the market. But, one thing is clear, we tend to simplify this highly complex environment by focusing on a few relevant indicators, XLF being one of them. The point is that XLF says that, for now, systemic risk is contained. Volatility indexes are sending the same message.


