Investing
Haven
No Result
View All Result
Forecasting Global Markets
  • Login
  • 2023 Forecasts
  • Stocks
  • Commodities
  • Silver
  • Lithium
  • Crypto
  • Top AI Stocks →
  • Top Silver Stocks →
  • TOP ENERGY STOCKS →
  • Top Lithium Stocks →
  • CRYPTO SELECTION →
Investing
Haven
  • 2023 Forecasts
  • Stocks
  • Commodities
  • Silver
  • Lithium
  • Crypto
No Result
View All Result
InvestingHaven
No Result
View All Result

Leading Volatility Indicator Flashes Early Warning Sign

by Taki Tsaklanos
July 07, 2023
in Markets & Stocks
0
volatility
Share on FacebookShare on Twitter

Volatility indexes are among the most reliable instruments with predictive value. However, it is imperative to understand how to read volatility indexes… and, equally important, how not to read them. In the weekend alerts of our Trade Alerts service we cover multiple volatility indexes, other than VIX, their message for the short to medium term direction of markets. While volatility indexes are accurate most of the time, there are times when their setup is not helping to predict future direction (it is imperative to understand when that’s the case). We were expecting a stiff drop in markets in the last 10 days of June which did became a mild pullback. However, during the trading session of July 6th, 2023, we got an early warning signs of the most reliable volatility index.

Recently, we wrote an educational piece on volatility indexes Decoding the VIX: Unveiling the Start of The 2023 Bull Market:

The VIX chart serves as a barometer of market volatility and investor sentiment. By studying its patterns and identifying significant events, we can gain valuable insights into market trends and potential turning points. Let’s dive into the details of the breakdown that occurred on October 13th and the subsequent developments that shaped the outlook for a new bull market.

While the VIX chart gives an important view, there is an even more important message we get from VIX of VIX (aka VVIX). As said in the past, the most reliable volatility index, say the leading indicator of volatility indexes, is VVIX.

The way to read VVIX is not easy though. We try to make it easy with our annotations.

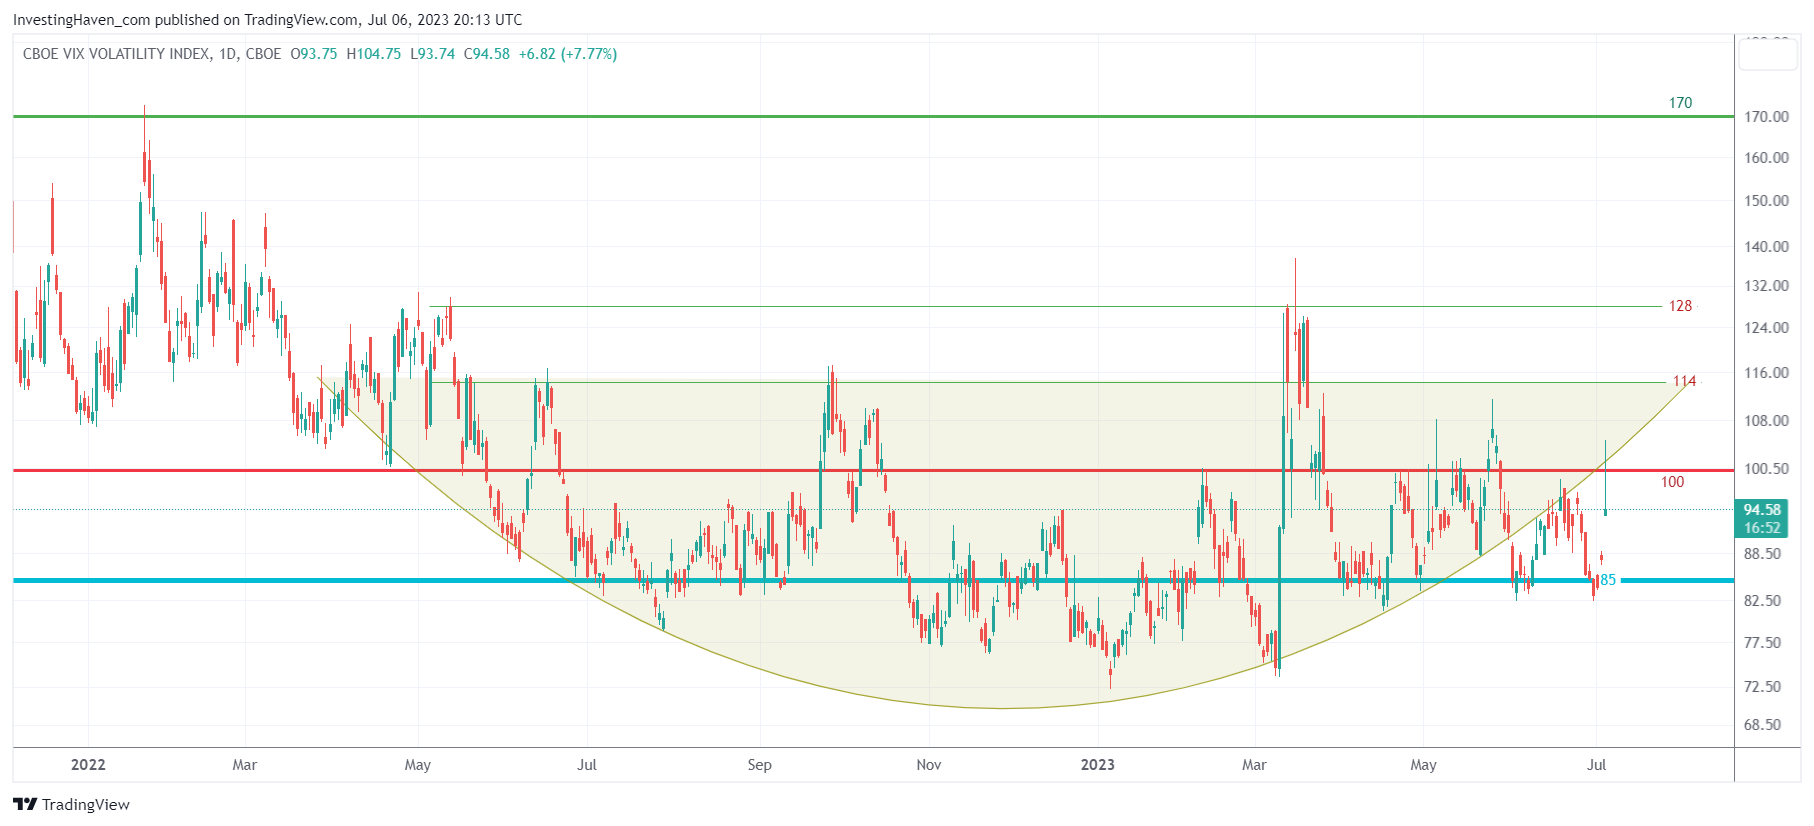
This is what we derive from the VVIX chart:

  • The rounded pattern is bullish VVIX but bearish for stocks, particularly the S&P 500.
  • VVIX fell below its rounded structure, in the last few days of May, this indicated relative and short term strength in stocks.
  • Since then, VVIX tried to get into its rounded pattern, some 10 days ago, but was unable to do so. This, again, confirmed relative strength of the S&P 500 (no big drop expected in the S&P 500).
  • Since April, VVIX is flirting with 85 points, its historic media, a level that suggests soft volatility and a bullish bias in the S&P 500 (also in stocks in general).
  • Yesterday, however, VVIX jumped back into the rounded pattern. It did close below it, even below 100 points.

Investors and traders need to watch VVIX carefully. Yesterday’s move was a first warning sign, not per se of a structural change in the market’s direction, but certainly a short term warning sign. VVIX needs to remain below 100 points, on a 3 day closing basis, in order for the bulls to remain in control.

Again, VVIX readings may change week-by-week. We try, in our weekend alerts in Trade Alerts, to decode the messages from volatility indexes, we pay special attention to VVIX as the leading indicator among volatility indexes.

volatility index

Receive our weekly newsletter.

*We hate spam as you do.

premium service trade alerts   premium service trade alerts   premium service crypto teaser  
WARNING: InvestingHaven.com, our site, is not affiliated and has no connection whatsoever with Invest Haven Group on Invest-Haven.com or Investing-Haven.com. InvestingHaven.com did not have and will never have sales reps. Do not accept financial offers, certainly not by telephone, this is why >>
Taki Tsaklanos

Taki Tsaklanos

Taki has +15 years of experience in global markets. His methodology is unique and effective, yet easy to understand; it is based on chart analysis combined with intermarket / fundamental / sentiment analysis. His work appeared on major financial outlets like FinancialSense, MarketWatch, ... Email: taki.tsaklanos@gmail.com. Twitter: twitter.com/investinghaven

Latest

stocks forecast

How To Know When The S&P 500 Confirms A Bullish Turning Point?

September 28, 2023
cryptocurrency forecast prediction

The Most Bullish Cryptocurrency Chart Setup Of October 2023

September 28, 2023
leading indicators

Will The S&P 500 Find Support At Its 200 Day Moving Average?

September 24, 2023
uranium stocks

Is The Breakout In The Uranium Market Confirmed?

September 24, 2023

Connect with InvestingHaven

Receive top notch forecasts for free.

*We hate spam as you do.

Categories

  • 2023 Forecasts
  • Stocks
  • Commodities
  • Silver
  • Lithium
  • Crypto

Site Navigation

  • RSS Feed
  • About us
  • Mission 2026
  • Sitemap
  • Privacy & Disclaimer
  • Terms of Service
  • InvestingHaven vs. Invest-Haven
  • Contact Us
Investing
Haven

Top notch forecasting with gold price forecast, many stock predictions, cryptocurrency charts. Many investing tips and crypto market analysis.

Copyright © 2023 InvestingHaven

No Result
View All Result
  • 2023 Forecasts
  • Stock market
  • AI Stocks
  • Alternative Energy
  • Lithium Articles
  • Lithium Stocks
  • Silver Articles
  • Silver Stocks
  • Crypto Articles
  • Premium Crypto Research
  • Premium Services & MyAccount

Copyright © 2023 InvestingHaven

Login to your account below

Forgotten Password?

Fill the forms bellow to register

All fields are required. Log In

Retrieve your password

Please enter your username or email address to reset your password.

Log In

    InvestingHaven.com honours your privacy. Read our Privacy Policy