Investing Haven
No Result
View All Result
Gold Silver Investing >>
CRYPTO INVESTING >>
  • 2025 Forecasts
    • 10 market predictions
    • Dow Jones forecast
    • S&P 500 forecast 2025
    • Nasdaq prediction 2025
    • Best altcoins to buy
    • Best crypto to buy now
    • Which crypto will explode
    • 15 crypto forecasts 2025
    • Which precious metal to buy
  • Silver
    • Silver prediction 2025 – 2030
    • Will silver exceed $30?
    • When will silver hit $50?
    • Can silver hit $100?
    • Silver shortage
    • 50-year silver chart
    • Silver bullish reversal
    • Silver seasonality charts
    • How to invest in silver
  • Gold
    • Gold prediction 2025 – 2030
    • Will gold set new ATH?
    • Will gold hit $3,000?
    • Can gold hit $10,000?
    • Gold chart 10 years
    • Gold chart 50 years
    • Gold chart 100 years
    • Gold silver ratio
    • Gold seasonality charts
  • Commodities
    • Coffee forecasts
    • Sugar forecasts
    • Nickel forecasts
    • Lithium investing
  • Crypto forecasts
    • BTC prediction 2025 – 2030
    • ETH prediction 2025 – 2030
    • SOL prediction 2025 – 2030
    • XRP prediction 2025 – 2030
    • XLM prediction 2025 – 2030
    • BNB prediction 2025 – 2030
    • ADA prediction 2025 – 2030
    • AVAX prediction 2025 – 2030
    • KAS prediction 2025 – 2030
    • NEAR prediction 2025 – 2030
    • BCH prediction 2025 – 2030
    • LINK prediction 2025 – 2030
    • DOT prediction 2025 – 2030
    • SUI prediction 2025 – 2030
    • ICP prediction 2025 – 2030
    • LTC prediction 2025 – 2026
    • STX prediction 2025 – 2030
    • DOGE prediction 2025 – 2030
    • SHIB prediction 2025 – 2030
    • PEPE prediction 2025 – 2030
    • FLOKI prediction 2025 – 2030
    • WIF prediction 2025 – 2030
    • ONDO prediction 2025 – 2030
  • News
    • Crypto news
    • Commodities
  • Login
Investing Haven
No Result
View All Result

Home » Markets & Stocks » Markets At Critical Levels. Watch These 2 Leading Indicators.

Markets At Critical Levels. Watch These 2 Leading Indicators.

Taki Tsaklanos by Taki Tsaklanos
November 28, 2023
in Markets & Stocks
crash
2k
VIEWS
Share on FacebookShare on Twitter

As many start fearing a global market crash in 2019 is underway we tend to stay calm and focused on leading indicators. No matter how scary things may look it is imperative to remain factual. After the long term picture we showed in the NYSE Composite Index 50 year long term chart we now turn our attention to the medium term timeframe. In this article we feature 2 leading indicators for market turmoil, and, as expected, they both are near critical levels.

Look at the news headlines of the last hour it would make you run to the hills. This is just a short overview of what the keyword ‘markets‘ returns on the internet:

Growth fears drive FTSE 100 to two-year closing low (The Guardian)

Alan Greenspan has a new warning for investors: ‘Run for cover’ (CNBC)

Volatile markets and a volatile president — What to know ahead of the Fed’s final meeting of 2018 (Yahoo! Finance)

Credit markets signal recession in early 2019 as central banks keep tightening (Telegraph)

How the smart money is reading the Fed’s tea leaves (CNN)

Oil nosedives to $46. Worries about economy collide with supply glut (CNN)

There is lots of emotions involved in this. And, in the end, one can endlessly look at data points, and always find a bull case and a bear case.

What we tend to do at InvestingHaven is identify a small number of really leading indicators so we can remain factual.

Our 2 Leading Indicators At Critical Levels

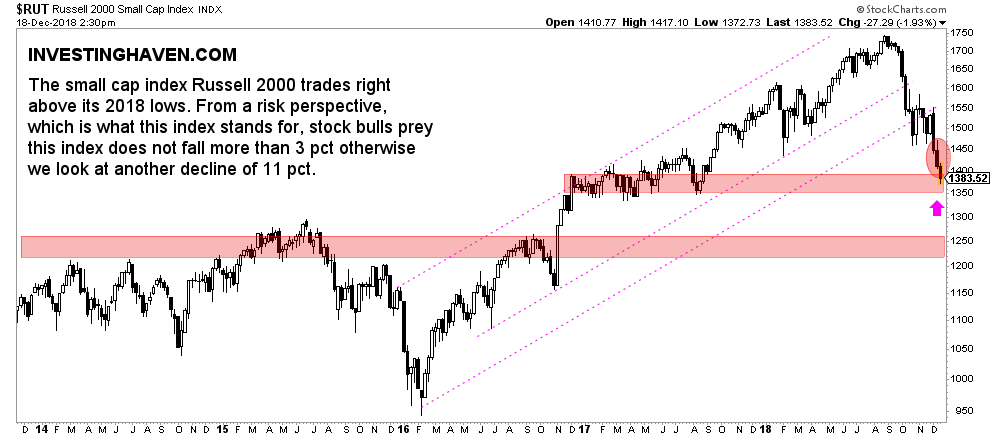
The first leading indicator is small caps represented by the Russell 2000 (RUT).

In the big picture we said that U.S. small cap stocks have a track record of signaling major tops and bottoms. For instance, the 2009 bottom came in right at the 2002 lows, so it was a great leading indicator.

Based on the long term chart we observed that U.S. small cap index have some 10 pct downside. We expect the 2014-2015 highs to provide sufficient support.

If we zoom in and look at the weekly chart on 5 years we see a somehow similar picture.

The small cap index which we consider a gauge for risk in risk assets (like stock markets) is right now at a major support level. It has some 3 pct downside. If this support gives way it will open the door for more downside more specifically another 11 pct. The latter is the same level we observed on the long term chart.

Monthly and weekly are nicely in synch.

small caps critical level

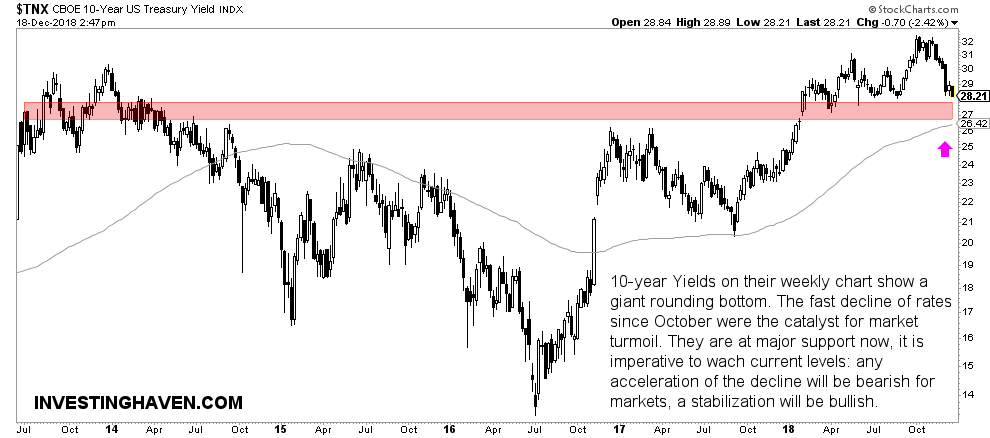
The second leading indicator is 10-year yields.

It has a track record of signaling major tops and bottoms primarily in U.S. stock markets one or two months before they happen.

On its 50 year chart we saw a potentially very disruptive event: 10-year Yields tried to break out from a falling trend that started 4 decades ago but fell back in their long term channel very recently. This breakout attempt started in August of this year, and we reported on this in great detail in Major Turning Point: End Of 40-Year Bull Market In Bonds. The breakout lasted for 3 months after which, a couple of weeks ago, Yields fell back in their channel. This may become a failed breakout, and, if so, will have a similar looking as the failed breakout of 2007.

On the weekly chart on 5 years shown below we see that 10-year Yields are near a major support area.

The weekly chart shows this giant rounding bottom. Most likely the fast decline of rates since October was the catalyst of market turmoil.

Let’s get things straight: if 10-year Yields continue to fall below 2.60 markets might be in trouble. An acceleration of the the decline, certainly below 2.60 will be the ultimate trigger for a global market crash of 2019.

Any stabilization above current levels will be bullish (neutral at worst) for markets.

10 year yields critical level

10-YEAR ANNIVERSARY OFFER: InvestingHaven.com celebrates 10 years. Temporarily, you can enjoy a discount on our premium gold/silver and crypto reports. Or you can become a VIP member. Go to our anniversary deals >>
Receive our weekly newsletter.

premium service SP-500 premium service trade alerts premium service crypto teaser 

No related posts.

Tags: RUSSELL2000TNX
Taki Tsaklanos

Taki Tsaklanos

Taki has +15 years of experience in global markets. He is passionate about forecasting markets - he calls it THE ART OF FORECASTING. His analysis methodology is unique and effective, yet easy to understand; it is based on chart analysis combined with intermarket / fundamental / sentiment analysis. His work appeared on major financial outlets like FinancialSense, MarketWatch,Twitter: twitter.com/investinghaven

Connect with InvestingHaven

Receive top notch forecasts for free.

*We hate spam as you do.

Site Navigation

  • RSS Feed
  • About us
  • Advertising
  • Sponsored Content Policy
  • Mission 2026
  • Sitemap
  • Privacy & Disclaimer
  • Terms of Service
  • Contact Us
investing haven logo

Precious metals market analysis including gold and silver price predictions. Crypto market analysis including highly accurate BTC ETH SOL XRP forecasts.

Copyright © 2025 InvestingHaven

Login to your account below

Forgotten Password?

Fill the forms bellow to register

All fields are required. Log In

Retrieve your password

Please enter your username or email address to reset your password.

Log In

Receive top notch forecasts for free.

*We hate spam as you do.

No Result
View All Result
  • News
  • 2025 Forecasts
    • 10 market predictions
    • Dow Jones forecast 2025
    • S&P 500 forecast 2025
    • Nasdaq prediction 2025
    • Best crypto to buy now
    • Which crypto will explode
    • Best altcoins to buy
    • 15 crypto forecasts 2025
    • Which precious metal to buy
  • Silver articles
    • Silver prediction 2025 – 2030
    • Will silver exceed $30?
    • When will silver hit $50?
    • Can silver hit $100?
    • Silver shortage
    • 50-year silver chart
    • Silver bullish reversal
    • Silver seasonality charts
    • How to invest in silver
  • Gold
    • Gold prediction 2025 – 2030
    • Will gold set new ATH?
    • Will gold hit $3,000?
    • Can gold hit $10,000?
    • Gold chart 10 years
    • Gold chart 50 years
    • Gold chart 100 years
    • Gold silver ratio
    • Gold seasonality charts
  • Commodities
    • Sugar forecasts
    • Coffee forecasts
    • Nickel forecasts
    • Lithium investing
  • Crypto news
  • Crypto forecasts
    • BTC prediction 2025 – 2030
    • ETH prediction 2025 – 2030
    • SOL prediction 2025 – 2030
    • XRP prediction 2025 – 2030
    • XLM prediction 2025 – 2030
    • BNB prediction 2025 – 2030
    • ADA prediction 2025 – 2030
    • AVAX prediction 2025 – 2030
    • KAS prediction 2025 – 2030
    • NEAR prediction 2025 – 2030
    • BCH prediction 2025 – 2030
    • LINK prediction 2025 – 2030
    • DOT prediction 2025 – 2030
    • SUI prediction 2025 – 2030
    • ICP prediction 2025 – 2030
    • LTC prediction 2025 – 2026
    • STX prediction 2025 – 2030
    • DOGE prediction 2025 – 2030
    • SHIB prediction 2025 – 2030
    • PEPE prediction 2025 – 2030
    • FLOKI prediction 2025 – 2030
    • WIF prediction 2025 – 2030
    • ONDO prediction 2025 – 2030
  • Premium Crypto Alerts
  • Premium services

Copyright © 2025 InvestingHaven