Investing Haven
No Result
View All Result
Gold Silver Investing >>
CRYPTO INVESTING >>
  • 2025 Forecasts
    • 10 market predictions
    • Dow Jones forecast
    • S&P 500 forecast 2025
    • Nasdaq prediction 2025
    • Best altcoins to buy
    • Best crypto to buy now
    • Which crypto will explode
    • 15 crypto forecasts 2025
    • Which precious metal to buy
  • Silver
    • Silver prediction 2025 – 2030
    • Will silver exceed $30?
    • When will silver hit $50?
    • Can silver hit $100?
    • Silver shortage
    • 50-year silver chart
    • Silver bullish reversal
    • Silver seasonality charts
    • How to invest in silver
  • Gold
    • Gold prediction 2025 – 2030
    • Will gold set new ATH?
    • Will gold hit $3,000?
    • Can gold hit $10,000?
    • Gold chart 10 years
    • Gold chart 50 years
    • Gold chart 100 years
    • Gold silver ratio
    • Gold seasonality charts
  • Commodities
    • Coffee forecasts
    • Sugar forecasts
    • Nickel forecasts
    • Lithium investing
  • Crypto forecasts
    • BTC prediction 2025 – 2030
    • ETH prediction 2025 – 2030
    • SOL prediction 2025 – 2030
    • XRP prediction 2025 – 2030
    • XLM prediction 2025 – 2030
    • BNB prediction 2025 – 2030
    • ADA prediction 2025 – 2030
    • AVAX prediction 2025 – 2030
    • KAS prediction 2025 – 2030
    • NEAR prediction 2025 – 2030
    • BCH prediction 2025 – 2030
    • LINK prediction 2025 – 2030
    • DOT prediction 2025 – 2030
    • SUI prediction 2025 – 2030
    • ICP prediction 2025 – 2030
    • LTC prediction 2025 – 2026
    • STX prediction 2025 – 2030
    • DOGE prediction 2025 – 2030
    • SHIB prediction 2025 – 2030
    • PEPE prediction 2025 – 2030
    • FLOKI prediction 2025 – 2030
    • WIF prediction 2025 – 2030
    • ONDO prediction 2025 – 2030
  • News
    • Crypto news
    • Commodities
  • Login
Investing Haven
No Result
View All Result

Home » Markets & Stocks » Stock Markets: The Most Important Months Of This Decade Are Here

Stock Markets: The Most Important Months Of This Decade Are Here

Taki T. by Taki T.
November 28, 2023
in Markets & Stocks
bull market bear market
2k
VIEWS
Share on FacebookShare on Twitter

Many believe the stock market crash of 2018 has started. We are not convinced, at least not yet. Although the decline in October 2018 was very unusual, as in very aggressive, there is still not enough evidence to believe that this is another 2008-alike crash. However, never say “never” in markets. It is instrumental to keep an open-mind for all outcomes. By analyzing the leading stock market charts it is clear that the next few months, if not next few weeks, will be the most important ones of this decade!

It is striking how many look for ‘reasons’ why this recent sell-off took place. Everything you will read about this topic is irrelevant. The only ‘real’ reason is capital shift within markets. Especially the end of the 40-year bond bull market is the culprit, nothing else. This is what it’s all about and what is at stake (quotes from our previous article):

Make no mistake, a 40-year bull market in bonds is, by far, the longest active bull market. A turning point in the 40-year bull market in bonds is not only major news, but also comes with major implications.

Let’s lay it out in plain simple terms: if this 40-year bull market in bonds in the U.S. turns into a bear market, with a U.S. bond market size of almost $40 trillion in Q1 of 2017, there will be capital seeking a new home to a level never-seen before.

In other words, a massive level of capital, never seen before, in the order of $40 trillion, will start moving around. Obviously, not all of it, but a considerable part will move elsewhere. Can anyone imagine what will happen if this becomes a trend into the same direction. Correct: stampede.

The point is that new trends would start because of a disruptive event in markets. Yes, the bond bull market has ended, it seems confirmed now. Consequently, it will for sure trigger new trends in other markets, but what exactly will it trigger?

Do we know at this point in time in which direction exactly markets will trend? The answer is “no”, and the key point is that new trends will become visible, so it is imperative to monitor markets very closely now, all markets, in order to understand which trend(s) will arise.

This is the result in stock markets at the time of writing.

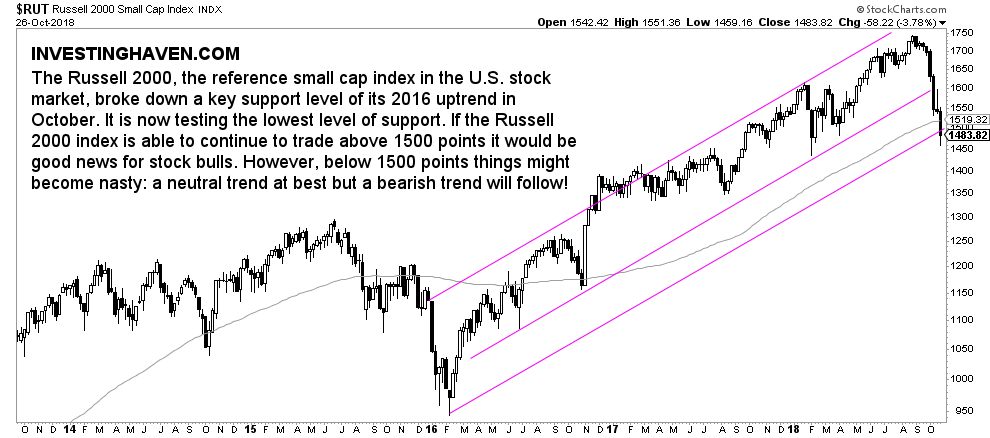
U.S. stocks: leading indicator Russell 2000

In the U.S. the Russell 2000 Index (RUT)which is our leading indicator is in the process of breaking down from its 2016 uptrend. Below is the weekly chart. A failed breakdown is still a possibility, as the weekly close was right at support, but any push lower is a confirmed breakdown. This would point to lower prices, and, most likely, the 2009 uptrend might be tested in the next few weeks and months.

Alternatively, a sideways trading range has started, but we need more data points, especially lows, to assess this.

Level to watch closely: 1490 in the Russell 2000.

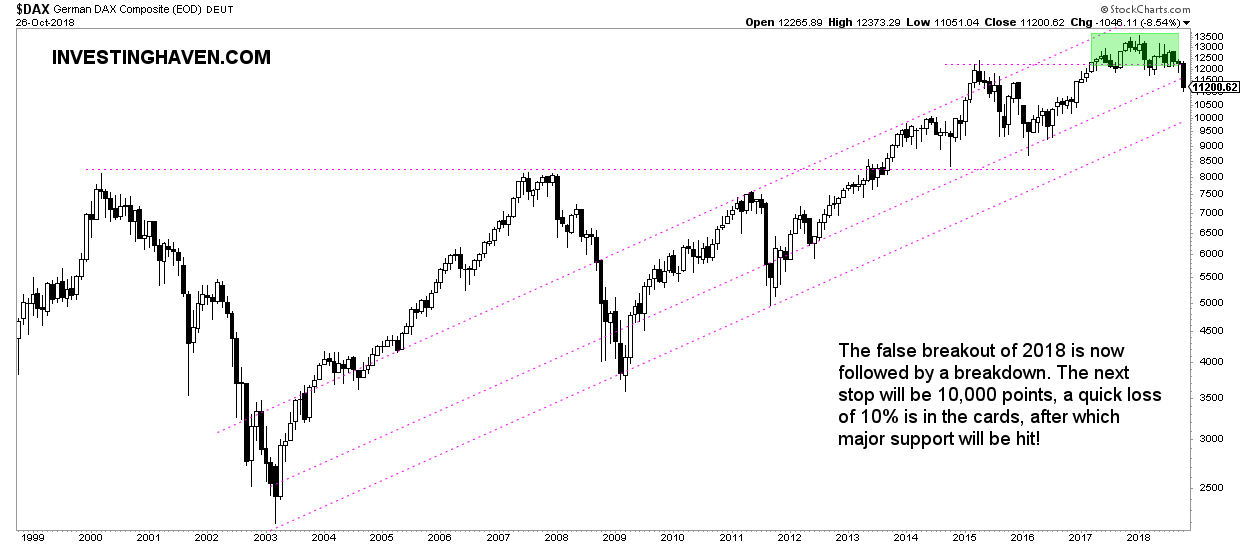
European stocks: leading indicator German DAX

The German DAX showed a failed breakout in 2018. Its 2016 uptrend is already broken, rather hard.

Now it is eyeing the 2009 uptrend which is support at 10,000 points, another decline of 10% is almost a given.

It will really (really) imperative that the 10,000 points level holds strong, otherwise we will be looking at the possibility of a crash. Not only in Germany, but also for global stock markets. The German DAX is a very reliable leading indicator for the rest of the world during bear markets!

Level to watch closely: 10, 000 points in the DAX index.

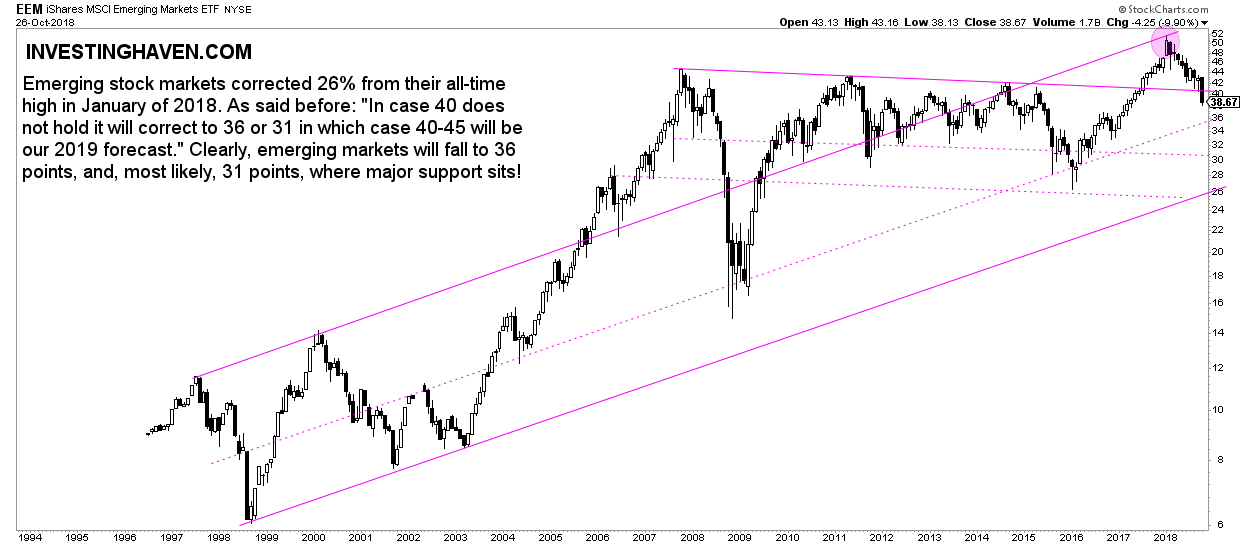
Emerging market stocks: leading indicator EEM ETF

Emerging markets were the first ones to give up this year. The breakdown (after a failed breakout) is confirmed! Now it is a matter of holding the 30 to 36 area.

Here as well, no damage to the secular uptrend, the one that started in 1998, but given the pace of the recent decline we want to see stopping power in the next few weeks and months. If not there will be serious damage.

Levels to watch closely: 30 to 36 points in EEM ETF.

10-YEAR ANNIVERSARY OFFER: InvestingHaven.com celebrates 10 years. Temporarily, you can enjoy a discount on our premium gold/silver and crypto reports. Or you can become a VIP member. Go to our anniversary deals >>
Receive our weekly newsletter.

premium service SP-500 premium service trade alerts premium service crypto teaser 

No related posts.

Tags: DAXEmerging Markets EEM ETFRUSSELL2000
Taki T.

Taki T.

Taki is a chart analyst who is passionate about unlocking unique insights out the chart. While the vast majority of analysts remain focused on price analysis, Taki starts with timeline analysis and adds price analysis to this. In doing so, he developed a unique methodology to find opportunities in financial markets, across assets and markets.

Connect with InvestingHaven

Receive top notch forecasts for free.

*We hate spam as you do.

Site Navigation

  • RSS Feed
  • About us
  • Advertising
  • Sponsored Content Policy
  • Mission 2026
  • Sitemap
  • Privacy & Disclaimer
  • Terms of Service
  • Contact Us
investing haven logo

Precious metals market analysis including gold and silver price predictions. Crypto market analysis including highly accurate BTC ETH SOL XRP forecasts.

Copyright © 2025 InvestingHaven

Login to your account below

Forgotten Password?

Fill the forms bellow to register

All fields are required. Log In

Retrieve your password

Please enter your username or email address to reset your password.

Log In

Receive top notch forecasts for free.

*We hate spam as you do.

No Result
View All Result
  • News
  • 2025 Forecasts
    • 10 market predictions
    • Dow Jones forecast 2025
    • S&P 500 forecast 2025
    • Nasdaq prediction 2025
    • Best crypto to buy now
    • Which crypto will explode
    • Best altcoins to buy
    • 15 crypto forecasts 2025
    • Which precious metal to buy
  • Silver articles
    • Silver prediction 2025 – 2030
    • Will silver exceed $30?
    • When will silver hit $50?
    • Can silver hit $100?
    • Silver shortage
    • 50-year silver chart
    • Silver bullish reversal
    • Silver seasonality charts
    • How to invest in silver
  • Gold
    • Gold prediction 2025 – 2030
    • Will gold set new ATH?
    • Will gold hit $3,000?
    • Can gold hit $10,000?
    • Gold chart 10 years
    • Gold chart 50 years
    • Gold chart 100 years
    • Gold silver ratio
    • Gold seasonality charts
  • Commodities
    • Sugar forecasts
    • Coffee forecasts
    • Nickel forecasts
    • Lithium investing
  • Crypto news
  • Crypto forecasts
    • BTC prediction 2025 – 2030
    • ETH prediction 2025 – 2030
    • SOL prediction 2025 – 2030
    • XRP prediction 2025 – 2030
    • XLM prediction 2025 – 2030
    • BNB prediction 2025 – 2030
    • ADA prediction 2025 – 2030
    • AVAX prediction 2025 – 2030
    • KAS prediction 2025 – 2030
    • NEAR prediction 2025 – 2030
    • BCH prediction 2025 – 2030
    • LINK prediction 2025 – 2030
    • DOT prediction 2025 – 2030
    • SUI prediction 2025 – 2030
    • ICP prediction 2025 – 2030
    • LTC prediction 2025 – 2026
    • STX prediction 2025 – 2030
    • DOGE prediction 2025 – 2030
    • SHIB prediction 2025 – 2030
    • PEPE prediction 2025 – 2030
    • FLOKI prediction 2025 – 2030
    • WIF prediction 2025 – 2030
    • ONDO prediction 2025 – 2030
  • Premium Crypto Alerts
  • Premium services

Copyright © 2025 InvestingHaven