Last week, we explained why we like tech stocks a lot. We also said: Tech Stocks Are Getting Close To A Secular Test And Potential Buy The Dip Opportunity. We will follow up on the tech sector chart as we head into what we think is a period with a buy the dip opportunity which continues to be consistent with articles we published back in October: our 2023 forecasts, no market crash in 2023, bullish patterns on leading indexes like Dow Jones and Nasdaq.
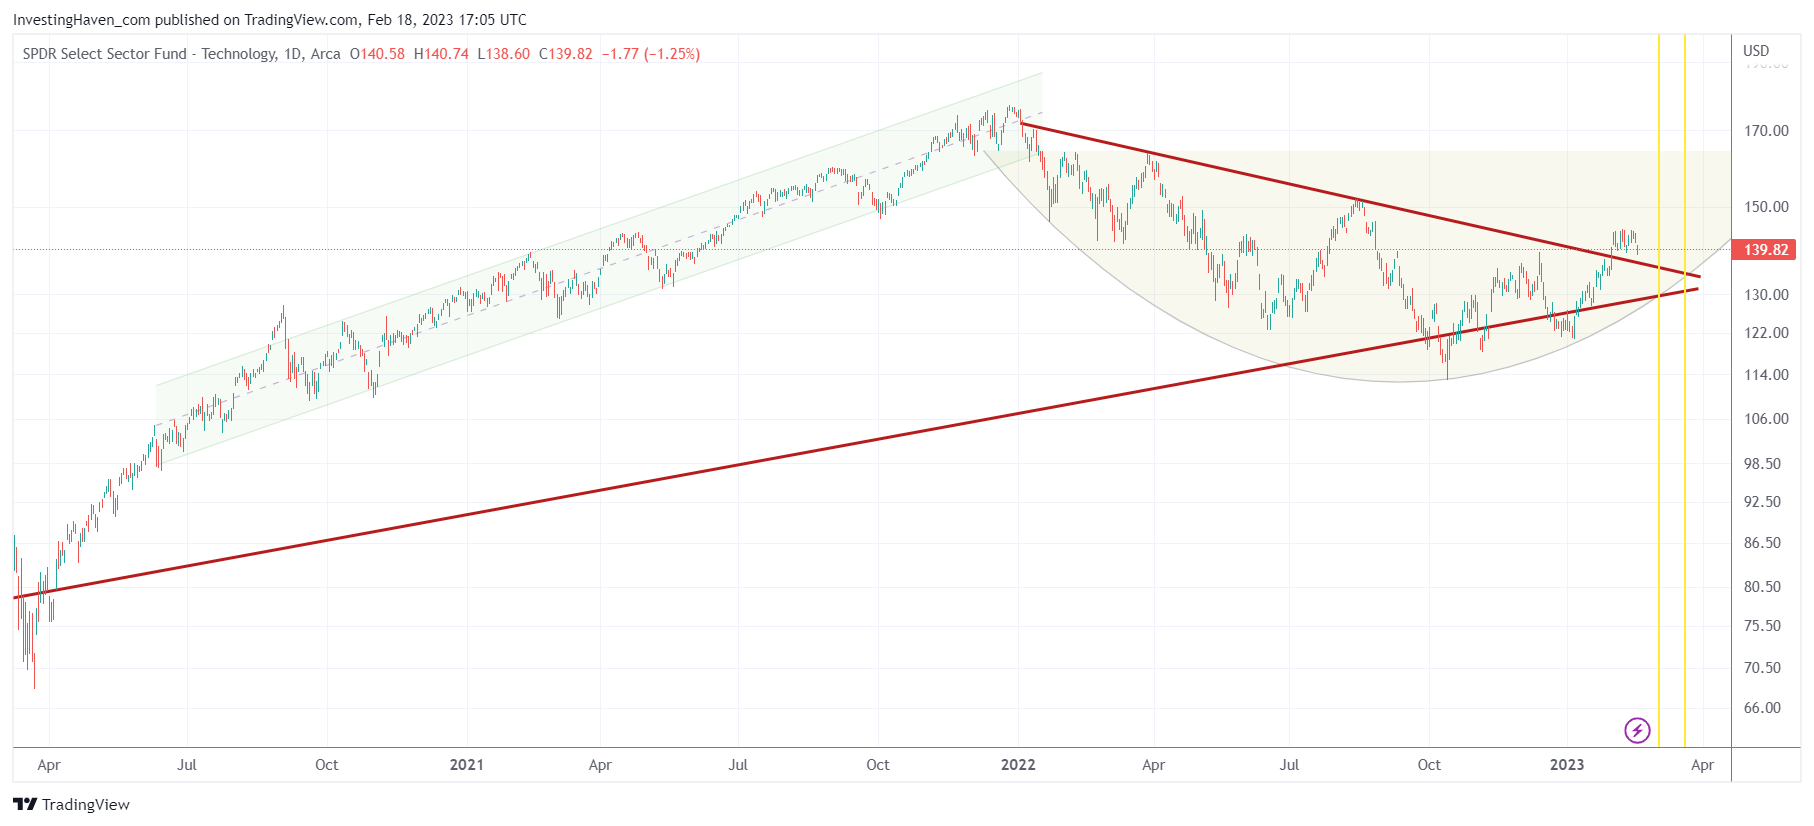
We look at the exact same chart that we covered recently: XLK ETF with the rounded bullish reversal combined with a long term rising trendline:
- The breakout that started three weeks ago is still holding remarkably well.
- The ‘horizontal resistance’ that was created in August of 2022 continues to be resistance.
- As time passes, it looks like price is gravitating towards to the point on the chart where all patterns coincide. That’s the area where the falling and rising trendline coincide with the rounded pattern.
- The yellow lines are dates that we derive from our timeline analysis. They are decisive dates.
- What we see is that price and time nicely gravitate towards a point on the chart, in a pretty fascinating way.
We continue to believe that the period between the yellow lines will come with a buy the dip opportunity provided the rounded pattern will hold. Same conclusion as last week, the market is clearly working towards this scenario.
In our stock market investing service Momentum Investing we are preparing a special about artificial intelligence stocks. We will pick out 2 high potential tech stocks to buy in March, aiming for 50 to 100 pct upside potential.


