Recently, we wrote a really important piece which was about a Time-Price Relationship Forecast of a Major Interest Rates Peak in 2023. Our point of view was simple: we look at 20-Treasuries, specifically the price point we derived on the decisive day which was November 9th, 2022, check the pattern against the price point of that day, only to find the big decision point on the chart. Now, one week later, we look at 10-year Yields, and add one more insight to our analysis: not later than Oct 10th, 2023, will we have a major decision, not just in rates but most markets. Is a stock market crash underway? We don’t think so! Will rate-sensitive markets like gold & silver move higher, as per our gold forecast & silver forecast? Presumably yes. In sum, we continue to expect an end-of-year rally in 2023, a foundational forecast in our 2023 outlook, one that will determine which which of the 3 points in time the Nasdaq will hit new ATH.
As said plenty of times, certain charts carry more weight than others. They act as crystal balls, offering insights into the potential future of various asset classes. In September 2023, one such chart is causing ripples of anticipation and apprehension alike – the 10-year Treasury yields (TNX). This seemingly innocuous line on a graph has the power to dictate the fate of risk assets like stocks, while simultaneously impacting rate-sensitive markets such as gold and silver. It’s a chart that tells a story of a looming crossroads, a juncture where the financial landscape could pivot dramatically.
The TNX Chart: A Tale of Two Scenarios
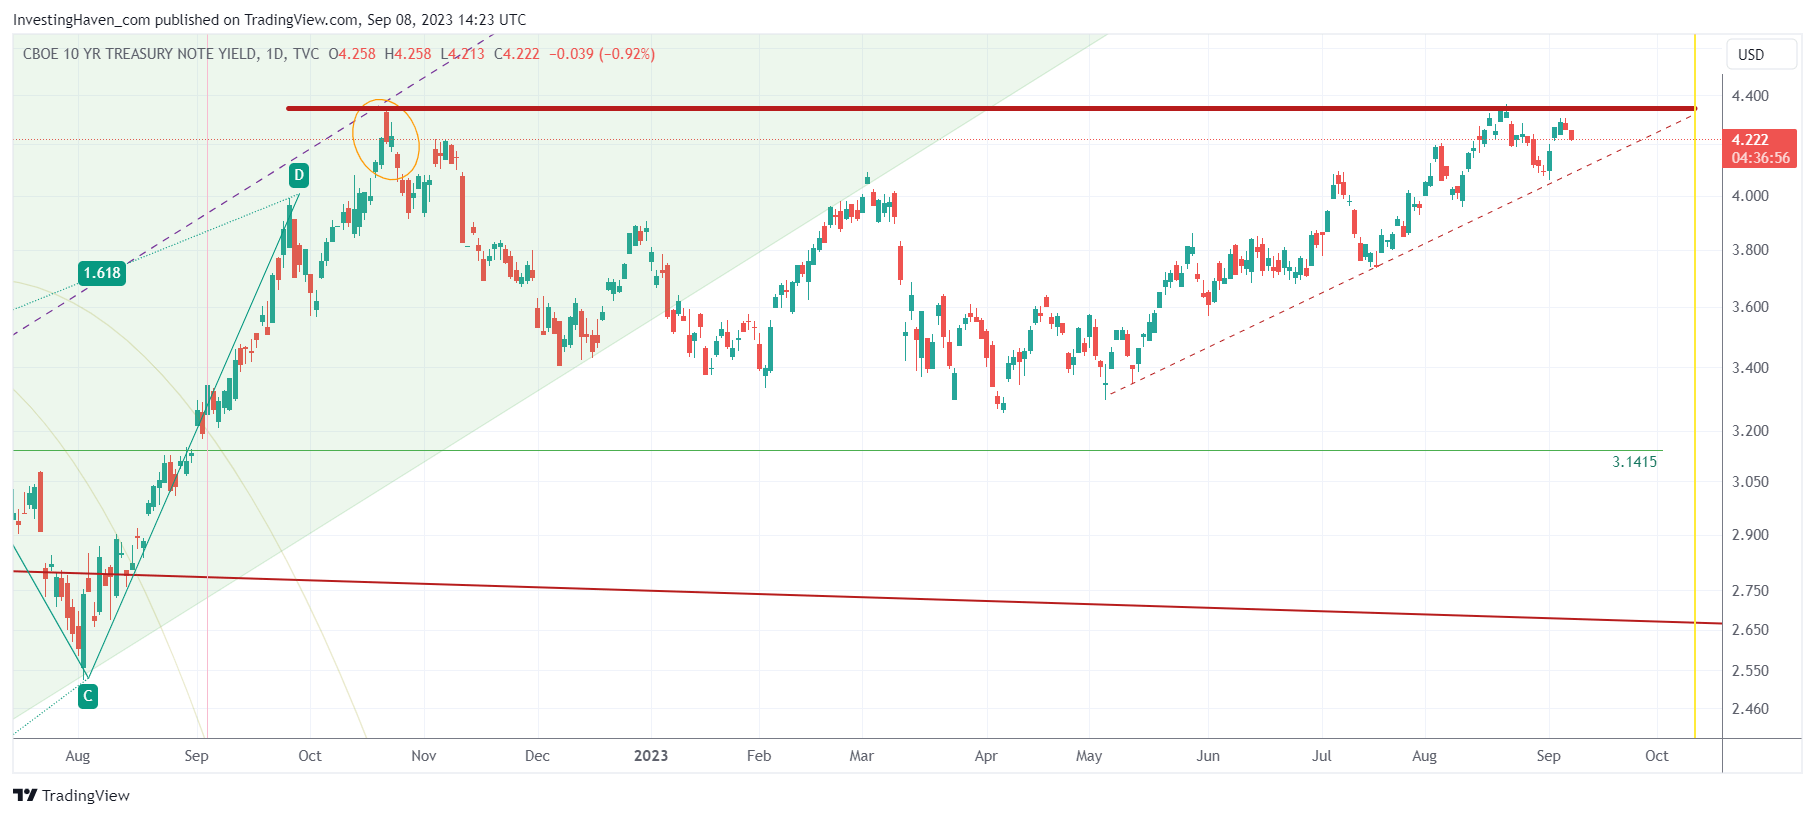
Behold the 10-year Treasury yields chart (TNX). To the untrained eye, it may appear as just another financial graph, but to seasoned investors and analysts, it’s a canvas painted with the brushstrokes of anticipation. What makes this chart so crucial is its role in signaling a potential major market shift.
At first glance, the chart reveals two compelling elements. The first is a formidable resistance level that the TNX has been grappling with, representing a significant barrier for yields. The second is a rising trendline that has been guiding the trajectory of rates upwards over time. These two elements create a unique dynamic, akin to a tug-of-war between bullish and bearish forces.
The Binary Outcome: A Pivotal Moment
As the days of September 2023 march on, all eyes are on this chart. It’s not just any chart; it’s a harbinger of change, a bearer of immense implications. Market participants are poised for a binary outcome – one that could set the tone for the months ahead.
- Scenario one: If the 10-year Treasury yields manage to breach the stubborn resistance level by or before October 10th, 2023, it could trigger a seismic shift. This breakout could send shockwaves through various asset classes, potentially sparking a rally in risk assets like stocks. Conversely, it might spell trouble for rate-sensitive markets like gold and silver, as rising yields often lead to a decrease in their appeal.
- Scenario two: Should the resistance hold, and the TNX fails to break free, the repercussions could be equally significant, albeit in the opposite direction. A failure to breach this key level might signal a protracted period of uncertainty and potential volatility. Risk assets could suffer, and the allure of precious metals could shine even brighter as investors seek safe havens amidst the turmoil.
Remember, not later than Oct 10th, 2023, will this pattern resolve. What’s most interesting, this date coincides with the start of a bullish window in our time-cycle analysis. We bet on rising markets.
Conclusion: The Countdown Begins
In the world of finance, timing is often everything. September 2023 has brought forth a chart that holds the power to redefine market dynamics. The TNX chart, with its unmistakable resistance and guiding trendline, is signaling a countdown. By the end of this month, we will know which path the 10-year Treasury yields are destined to take. Will they rise and lead to an explosion in risk assets, or will they falter, potentially causing disruptions in various markets?
One thing is certain – this single chart is the most important piece of the puzzle for investors and analysts in September 2023. It’s a chart that reminds us that in the financial world, as in life, change is the only constant, and its arrival can be both electrifying and daunting. We stand at the precipice, awaiting the outcome that this chart will reveal, fully aware of the immense impact it could have on our portfolios and the broader financial landscape.
Do you like this type of analysis? Then please sign up to Momentum Investing for weekly analysis, in-depth research reports (AI stocks, silver stocks, lithium stocks, alternative energy stocks), all included in a tiny monthly fee relative to the value you get back from us.