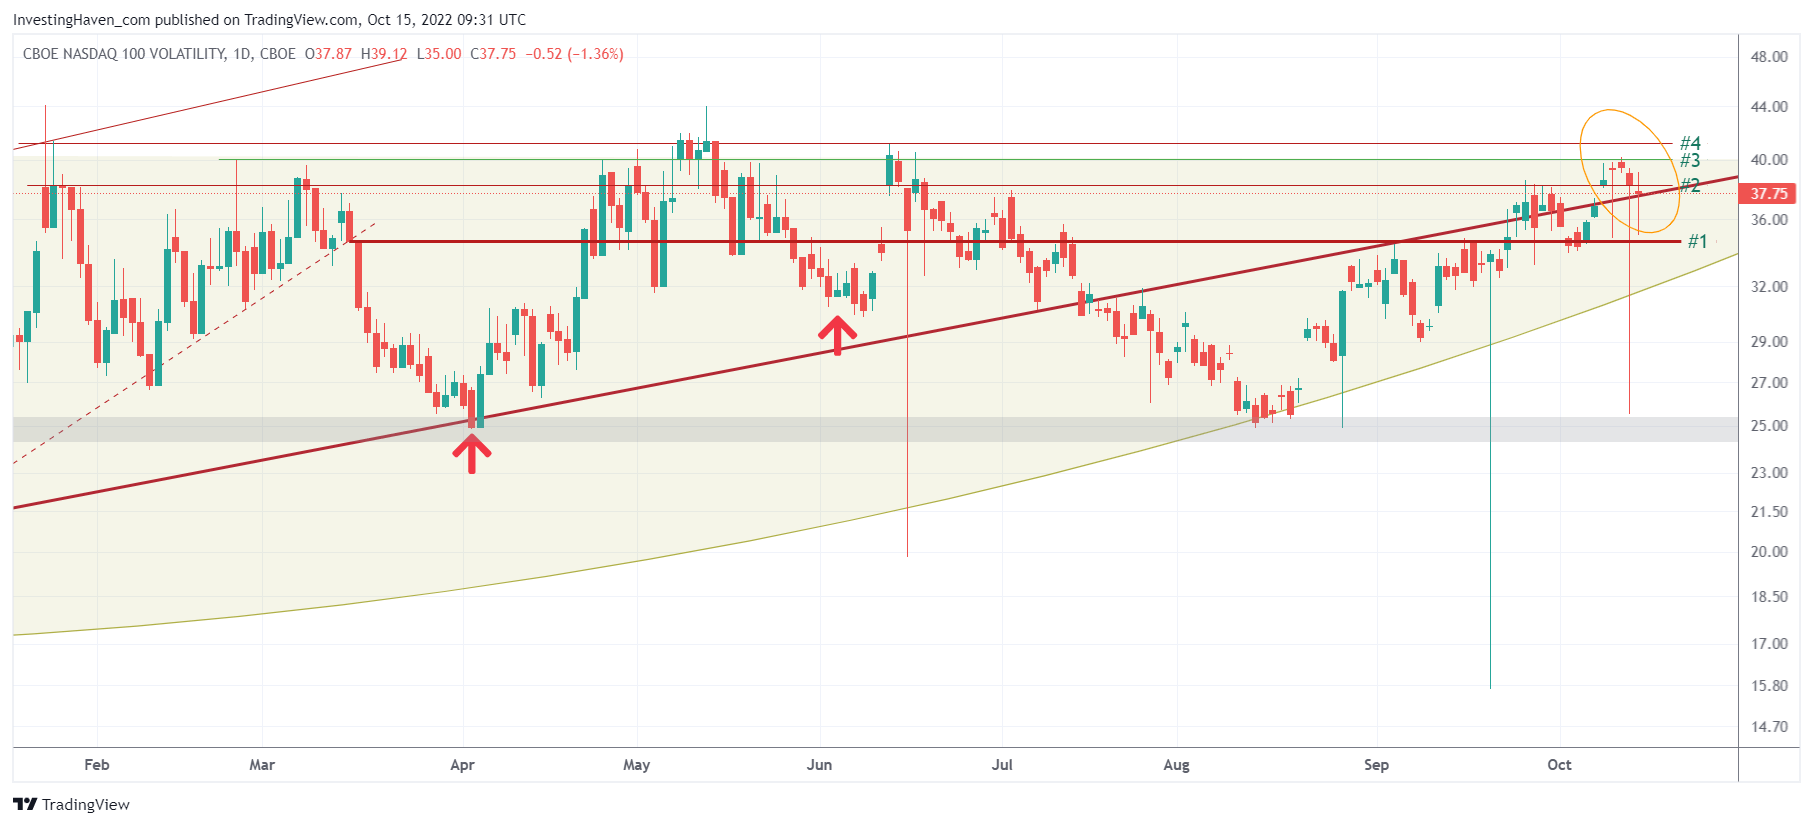
In this short update we follow up on one indicator that we shared on Thursday Oct 13th, particularly in this post The Market Will Not Move 50% Lower Contrary To What The Gurus Are Telling You. The indicator we are talking about is the Nasdaq indicator with a track record forecasting the next move in the Nasdaq: the volatility index of the Nasdaq. We take volatility indexes very seriously, as explained in forecasting markets with this indicator.
We made the point, earlier this week, that the markets are likely not going to move strongly lower. This is the relevant quote:
Whenever there is a confirmed real breakdown it is justified to exit the market and reduce positions. So, the point from this week is this: did markets set an epic bottom or is the real breakdown underway? Stated differently, was it wise to sell on October 13th, 2022 or was it wise to hold onto your positions. We firmly believe it is the latter. We firmly believe the bottom is set in markets, for a variety of reasons. We firmly believe that our recommended HOLD strategy in 2022 is going to be proven the right one, in a few months from now.
The one indicator we used was the Nasdaq volatility index, a very reliable indicator which if read accurately can help understand the next move of the Nasdaq prior to starting.
Note that the Nasdaq volatility index is a volatility index similar to VIX but it should be read differently.
We believe the Nasdaq volatility index is confirming that it is topping. We call the last 3 to 7 days a micro-pattern. Whenever such a micro-pattern is created near an important trendline, support or resistance, it tends to be a high confidence turning point.
We can see that the Nasdaq volatility index is topping right at the May and June highs. We believe the market is more likely going to start a countertrend rally than a breakdown.
How to know whether the market will bottom? This is a Tip To Understand If The Market Is Setting A Bottom.


