After the US Dollar had a major run going into 2022, we saw the price start to pull back in May 2022. The question now is did the US Dollar price peak at $105? Is the parabolic move exhausted or are we about to see another leg up in the USD?
To understand the US Dollar, an important component of our analysis, we relay on the following:
- Intermarket dynamics
- The price action
The US Dollar and Intermarket Dynamics
Looking at the big picture is key to understanding the intermarket dynamics and how they could impact the future price direction of asset classes of interest. Therefore, you will find below a recap with links to what we’ve shared in previous articles in order to tie everything together. We want investors to leave with actionable insight and the important price levels to watch.
We’ve recently covered commodities, from the $CRB index to Silver. An interesting find in why Silver price is still constructive was how some long term correlations were broken (temporarily of forever, time will tell). We also looked into The Nasdaq volatility index and what it means for the stock market. Same with junk bonds, which were pointing to a possible bounce in equities therefore validating observations from our leading indicators.
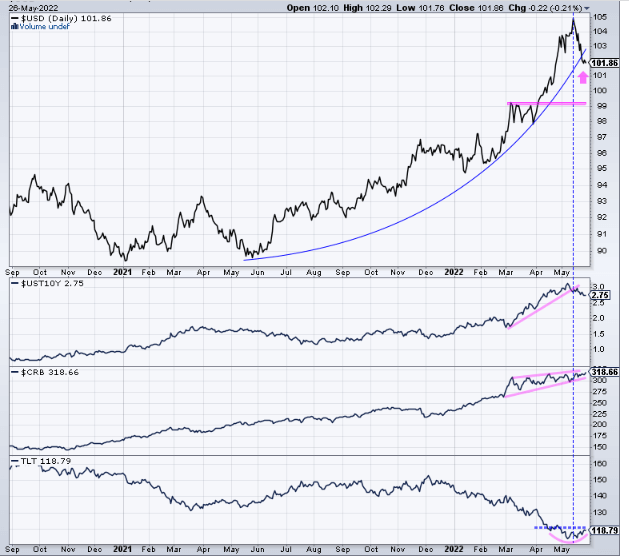
As of today, and in a nutshell, this is what we have observed for those different asset classes
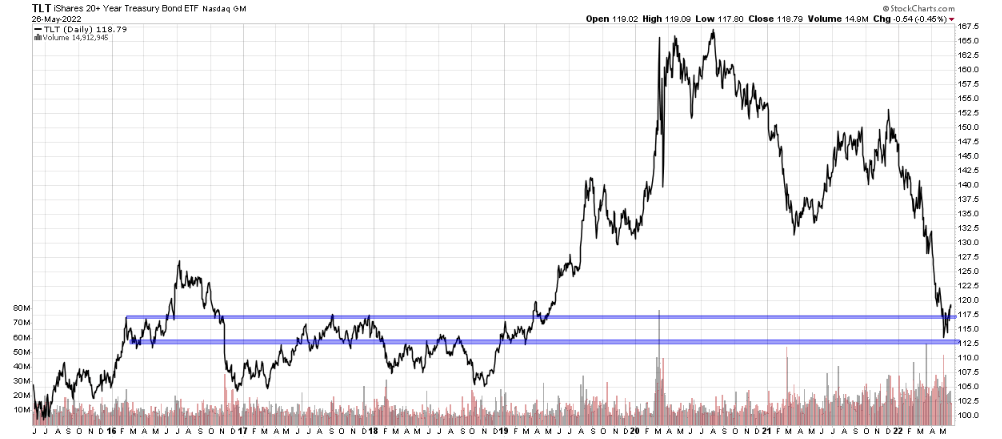
Bonds could be bottoming at these levels and yields already broke down from their parabolic move
Silver is trying to reverse, commodities in general facing overhead resistance but overall making higher lows which leads to the possibility of an upside breakout.
Junk bonds, the ultimate risk taking appetite indicator at support level.
A zoom in on bonds is warranted to show how a bottom could be setting up at these levels. Invalid if below the annotated support area:
What does this mean for the US Dollar price
A falling yield is bearish for the US dollar but commodities thrive when the USD trends lower. Contrary to general belief, Commodities and equities could trend up simultaneously. Gold is an exception, it shouldn’t be considered in the same basket. We will be covering its performance in a separate article.
Based on this perspective, $105 could have been a top, at least temporarily.
Next is the USD price chart. We want to identify the dominating pattern on the US Dollar chart, price levels investors should keep an eye on and what different correlations could indicate for the USD’s future price action.
The US Dollar price chart
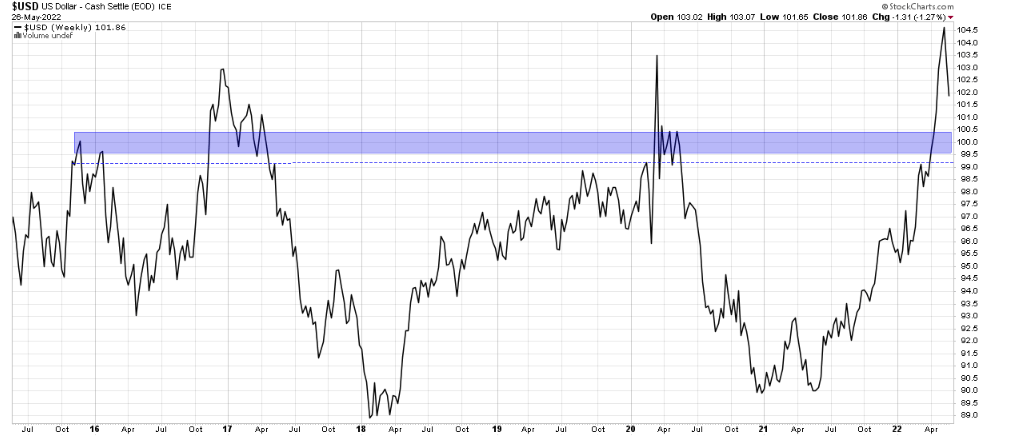
On the USD’s long term price chart, we see a possible triple top. We also have a breakout above that $99 to $100 area. Next is probably a back test of that previous important resistance area. If it holds and becomes support, the US Dollar might go higher from there.
Price might also become range bound in between the support and resistance area and we do not want to be buyers in that directionless chop. Basically, the USD will only turn Bullish if above $105.
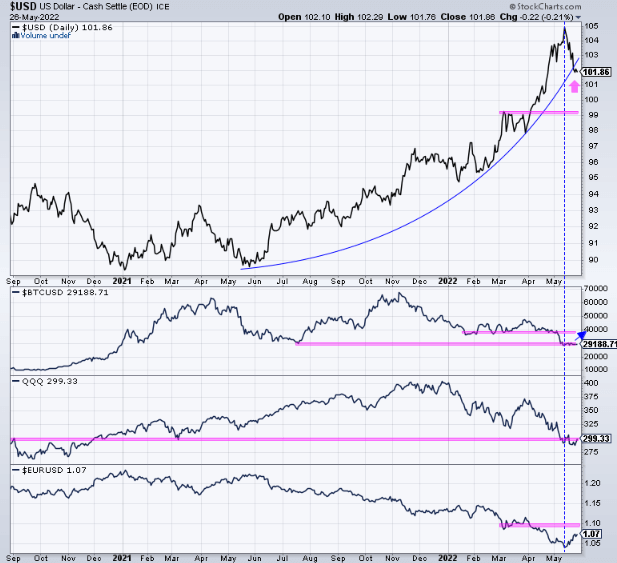
This chart above is a bonus showing how the USD price can affect other currencies and asset classes. Many are about to choose a direction.
Since the toppy action in the USD in May, Bitcoin is moving sideways trying to reverse (we covered this last week in our Bitcoin dominance article). Same for the Euro and growth stocks. The Euro and tech has some serious overhead resistance to overcome however.
All in all, The US Dollar could have topped at $105 and will either consolidate or drift lower from here. This should give a boost to commodities and possibly Bitcoin’s price as per InvestingHaven’s 2022 forecast.
Another leg up in the US dollar is not completely out of the question yet till that support is broken. Also the uncertainty on the international levels could also be a wild card for USD bulls.
Written by hdcharting.


