Investing Haven
No Result
View All Result
Gold Silver Investing >>
CRYPTO INVESTING >>
  • 2025 Forecasts
    • 10 market predictions
    • Dow Jones forecast
    • S&P 500 forecast 2025
    • Nasdaq prediction 2025
    • Best altcoins to buy
    • Best crypto to buy now
    • Which crypto will explode
    • 15 crypto forecasts 2025
    • Which precious metal to buy
  • Silver
    • Silver prediction 2025 – 2030
    • Will silver exceed $30?
    • When will silver hit $50?
    • Can silver hit $100?
    • Silver shortage
    • 50-year silver chart
    • Silver bullish reversal
    • Silver seasonality charts
    • How to invest in silver
  • Gold
    • Gold prediction 2025 – 2030
    • Will gold set new ATH?
    • Will gold hit $3,000?
    • Can gold hit $10,000?
    • Gold chart 10 years
    • Gold chart 50 years
    • Gold chart 100 years
    • Gold silver ratio
    • Gold seasonality charts
  • Commodities
    • Coffee forecasts
    • Sugar forecasts
    • Nickel forecasts
    • Lithium investing
  • Crypto forecasts
    • BTC prediction 2025 – 2030
    • ETH prediction 2025 – 2030
    • SOL prediction 2025 – 2030
    • XRP prediction 2025 – 2030
    • XLM prediction 2025 – 2030
    • BNB prediction 2025 – 2030
    • ADA prediction 2025 – 2030
    • AVAX prediction 2025 – 2030
    • KAS prediction 2025 – 2030
    • NEAR prediction 2025 – 2030
    • BCH prediction 2025 – 2030
    • LINK prediction 2025 – 2030
    • DOT prediction 2025 – 2030
    • SUI prediction 2025 – 2030
    • ICP prediction 2025 – 2030
    • LTC prediction 2025 – 2026
    • STX prediction 2025 – 2030
    • DOGE prediction 2025 – 2030
    • SHIB prediction 2025 – 2030
    • PEPE prediction 2025 – 2030
    • FLOKI prediction 2025 – 2030
    • WIF prediction 2025 – 2030
    • ONDO prediction 2025 – 2030
  • News
    • Crypto news
    • Commodities
  • Login
Investing Haven
No Result
View All Result

Home » Markets & Stocks » U.S. Small Cap Stocks At Make-or-Break Level In October 2018

U.S. Small Cap Stocks At Make-or-Break Level In October 2018

Taki Tsaklanos by Taki Tsaklanos
November 28, 2023
in Markets & Stocks
bull market bear market
2k
VIEWS
Share on FacebookShare on Twitter

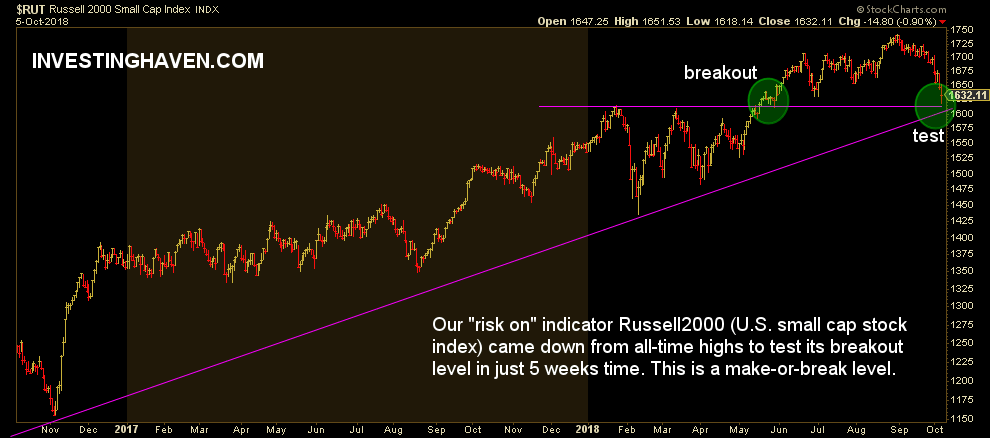
U.S. small cap stocks are one of our few ‘risk on’ leading indicators. If they do well it is a good time to invest in stocks while the opposite is true as well. Right now, at the start of October 2018, U.S. small cap stocks are at a make-or-break level. Is this the start of a Stock Market Crash In 2018 or the end of a temporary retracement?

As said recently markets are witnessing one of the most important market events of this decade. Markets are at a major turning point with the End Of 40-Year Bull Market In Bonds. This will have major implications though the market has to show the direction.

In essence, this is what the market and investors have to deal with now:

In other words, a massive level of capital, never seen before, in the order of $40 trillion, will start moving around. Obviously, not all of it, but a considerable part will move elsewhere. Can anyone imagine what will happen if this becomes a trend into the same direction. Correct: stampede.

Logically, capital will seek its way to one of the other key assets, either risk-on or risk-off assets. If the bond exodus will go to risk-on assets we will see stock market indexes move higher in the next weeks and months. If markets will favor risk-off we will see a steady rise in the USD as well as the Yen, presumably also the Swiss Franc. What about gold? Hard to say, as gold has many faces, it can behave as a fear asset but also as an inflationary asset.

U.S. Small Cap Stocks Testing Breakout In October 2018

It is critical to closely follow what the U.S. small cap stock index Russell 2000 does. That’s because it is one of our few risk-on indicators.

We pay special attention to trend changes and pattern invalidations, or, the opposite of course, pattern continuation.

The daily chart of U.S. small cap stocks has a clear and outspoken pattern. The Russell 2000 index, representing U.S. small cap stocks, came back from its all-time highs some 5 weeks ago only to test its breakout level now. Note the two green circles on this first chart.

Moreover, the breakout level at 1610 points coincides with the rising trendline.

This means that 1610 in Russell 2000 is a critical price point as it represents double support. As per Tsaklanos his 1/99 Investing Principles only 1% of price points on a chart is relevant, this is a textbook example of this principle.

U.S. small cap stocks october 2018

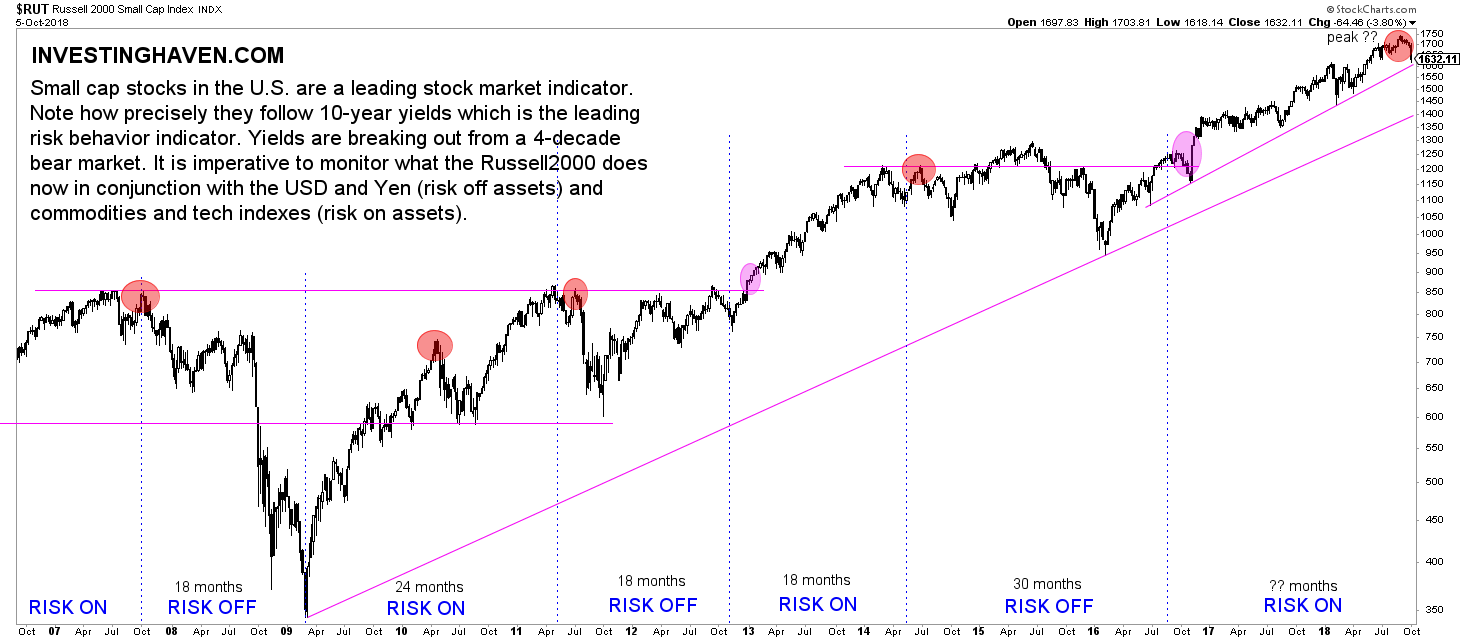
U.S. Small Cap Stocks: The Bigger Picture

It is key when doing chart analysis to check multiple timeframes of the same chart.

While the above chart is the daily timeframe on 2 years we embed the weekly timeframe on 12 years below.

Moreover, below chart indicates the dominant risk-on vs. risk-off periods in the last 12 years.

As seen, the current retracement represents a normal move to the support area of the rising trend. No harm done, and that’s in line with the daily chart above.

Is the Rusell 2000 all-time high of 1,742.09 set on August 31st 2018 the turning point, and is this in any way correlated to the breakdown of bond markets discussed above? This may be the case, but seems hard to accept since falling bonds (risk-on) and falling stocks (risk-off) would imply that capital moves to the USD which is a trend we have not really seen yet. 

It is early to draw conclusions. Although a falling bond market may come with a falling stock market, you better never say “never” in markets, this really seems a counter intuitive scenario. 

We favor the scenario in which there is sector rotation in stock markets right now, something that typically happens during a retracement.

We stay open for every scenario though!

US small cap stocks weekly october 2018

10-YEAR ANNIVERSARY OFFER: InvestingHaven.com celebrates 10 years. Temporarily, you can enjoy a discount on our premium gold/silver and crypto reports. Or you can become a VIP member. Go to our anniversary deals >>
Receive our weekly newsletter.

premium service SP-500 premium service trade alerts premium service crypto teaser 

No related posts.

Tags: RUSSELL2000
Taki Tsaklanos

Taki Tsaklanos

Taki has +15 years of experience in global markets. He is passionate about forecasting markets - he calls it THE ART OF FORECASTING. His analysis methodology is unique and effective, yet easy to understand; it is based on chart analysis combined with intermarket / fundamental / sentiment analysis. His work appeared on major financial outlets like FinancialSense, MarketWatch,Twitter: twitter.com/investinghaven

Connect with InvestingHaven

Receive top notch forecasts for free.

*We hate spam as you do.

Site Navigation

  • RSS Feed
  • About us
  • Advertising
  • Sponsored Content Policy
  • Mission 2026
  • Sitemap
  • Privacy & Disclaimer
  • Terms of Service
  • Contact Us
investing haven logo

Precious metals market analysis including gold and silver price predictions. Crypto market analysis including highly accurate BTC ETH SOL XRP forecasts.

Copyright © 2025 InvestingHaven

Login to your account below

Forgotten Password?

Fill the forms bellow to register

All fields are required. Log In

Retrieve your password

Please enter your username or email address to reset your password.

Log In

Receive top notch forecasts for free.

*We hate spam as you do.

No Result
View All Result
  • News
  • 2025 Forecasts
    • 10 market predictions
    • Dow Jones forecast 2025
    • S&P 500 forecast 2025
    • Nasdaq prediction 2025
    • Best crypto to buy now
    • Which crypto will explode
    • Best altcoins to buy
    • 15 crypto forecasts 2025
    • Which precious metal to buy
  • Silver articles
    • Silver prediction 2025 – 2030
    • Will silver exceed $30?
    • When will silver hit $50?
    • Can silver hit $100?
    • Silver shortage
    • 50-year silver chart
    • Silver bullish reversal
    • Silver seasonality charts
    • How to invest in silver
  • Gold
    • Gold prediction 2025 – 2030
    • Will gold set new ATH?
    • Will gold hit $3,000?
    • Can gold hit $10,000?
    • Gold chart 10 years
    • Gold chart 50 years
    • Gold chart 100 years
    • Gold silver ratio
    • Gold seasonality charts
  • Commodities
    • Sugar forecasts
    • Coffee forecasts
    • Nickel forecasts
    • Lithium investing
  • Crypto news
  • Crypto forecasts
    • BTC prediction 2025 – 2030
    • ETH prediction 2025 – 2030
    • SOL prediction 2025 – 2030
    • XRP prediction 2025 – 2030
    • XLM prediction 2025 – 2030
    • BNB prediction 2025 – 2030
    • ADA prediction 2025 – 2030
    • AVAX prediction 2025 – 2030
    • KAS prediction 2025 – 2030
    • NEAR prediction 2025 – 2030
    • BCH prediction 2025 – 2030
    • LINK prediction 2025 – 2030
    • DOT prediction 2025 – 2030
    • SUI prediction 2025 – 2030
    • ICP prediction 2025 – 2030
    • LTC prediction 2025 – 2026
    • STX prediction 2025 – 2030
    • DOGE prediction 2025 – 2030
    • SHIB prediction 2025 – 2030
    • PEPE prediction 2025 – 2030
    • FLOKI prediction 2025 – 2030
    • WIF prediction 2025 – 2030
    • ONDO prediction 2025 – 2030
  • Premium Crypto Alerts
  • Premium services

Copyright © 2025 InvestingHaven