The Corona market crash made history, and since then we have seen a series of historic and unusual ‘events’. Think of the negative crude oil futures price, historic rises and historic declines across sectors, the divergence between the Dow Jones and the Nasdaq, and the list is much longer. If anything, having the right leading indicators in place is crucial for success in 2021. One such leading indicator in forecasting market trends in 2021 is the Euro, and it might set one of the most important trends in one of the most impressive charts of 2021.
As said before the Euro is a leading indicator for risk assets.
In March we wrote this Decision Time: This Leading Market Indicator Is Testing Secular Risk Levels
What all this means is that, after a massive RISK ON breakout in December markets are now ‘testing’ this breakout level. The importance of this is huge. If the Euro trades above 1.19 points on a weekly and monthly open/closing basis it will support RISK ON globally. We call it ‘secular risk levels’, and the Euro suggests that global markets are in the process of ‘testing’ those risk levels.
We better pay attention to the Euro’s closing price of March, as well as price action in April, for stocks as well as commodities.
In May we wrote Leading Risk Indicator EURO Eager To Confirm A New Secular Bull Market
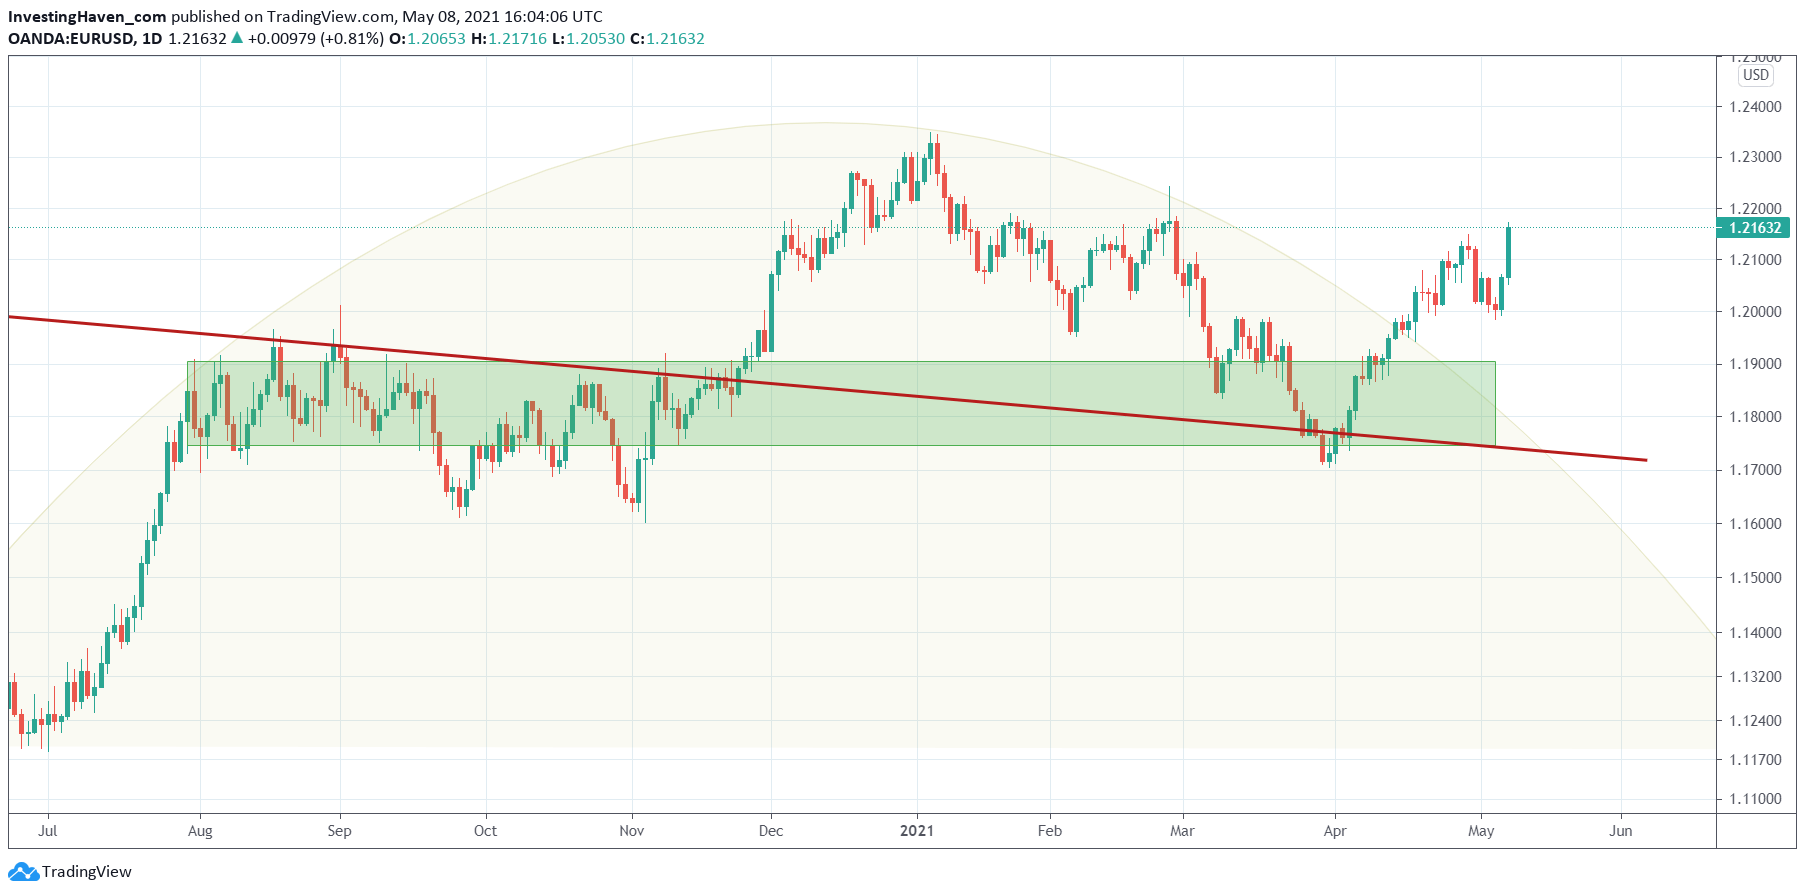
Our point of view is that the ultimate confirmation of a new secular bull trend in the Euro will be there once the EURUSD trades above 1.18 points and the Euro index (below) breaks the falling trendline to the upside. A few more months are required to meet both conditions. Ultimately we believe it will happen late this year, and it will bring good momentum into markets (again, which is a while ago).
Today’s daily Euro chart looks really bullish. It broke up some 2 – 3 weeks ago, out of the rounded pattern, after hitting the red trendline. It is pretty simple: either the Euro is hitting resistance here at 1.22 OR will it will be setting multi-year highs anytime soon!
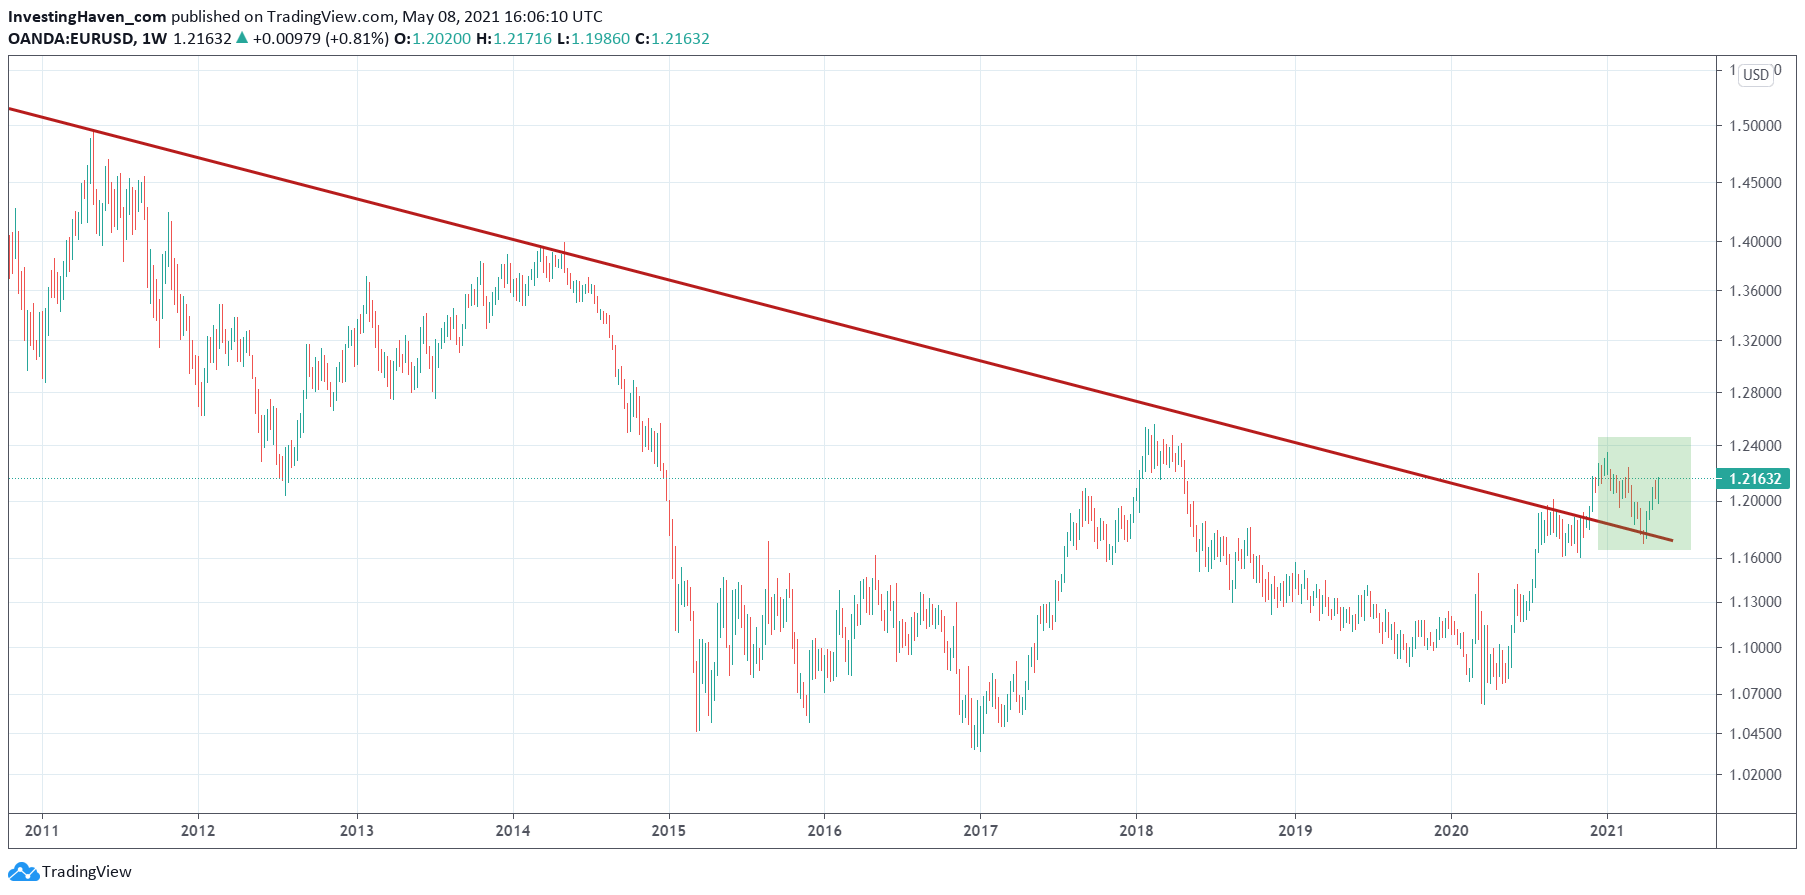
In order to understand the importance of red trendline from the daily chart above we have to zoom out. The monthly chart shows that this is not your average trendline. It is a 12 year bear market trendline.
What’s more, the Euro did ‘successfully test’ this trendline last month, on April 1st to be precise. Right now it might be setting what we call a bullish reversal right at that trendline.
What all this means is simple: supportive of global stocks as well as commodities. The stock market party isn’t over, and presumably emerging markets and European markets will be among the big beneficiaries.
Watch out though not all stocks will do equally well. There is a violent sector divergence as visualized in this article The 4 Ugliest Crashes After Hitting ATH In 2021
Stock picking and sector picking is crucial for success even if the Euro is turning its 12 year downtrend into a new uptrend!


