Investing Haven
No Result
View All Result
Gold Silver Investing >>
CRYPTO INVESTING >>
  • 2025 Forecasts
    • 10 market predictions
    • Dow Jones forecast
    • S&P 500 forecast 2025
    • Nasdaq prediction 2025
    • Best altcoins to buy
    • Best crypto to buy now
    • Which crypto will explode
    • 15 crypto forecasts 2025
    • Which precious metal to buy
  • Silver
    • Silver prediction 2025 – 2030
    • Will silver exceed $30?
    • When will silver hit $50?
    • Can silver hit $100?
    • Silver shortage
    • 50-year silver chart
    • Silver bullish reversal
    • Silver seasonality charts
    • How to invest in silver
  • Gold
    • Gold prediction 2025 – 2030
    • Will gold set new ATH?
    • Will gold hit $3,000?
    • Can gold hit $10,000?
    • Gold chart 10 years
    • Gold chart 50 years
    • Gold chart 100 years
    • Gold silver ratio
    • Gold seasonality charts
  • Commodities
    • Coffee forecasts
    • Sugar forecasts
    • Nickel forecasts
    • Lithium investing
  • Crypto forecasts
    • BTC prediction 2025 – 2030
    • ETH prediction 2025 – 2030
    • SOL prediction 2025 – 2030
    • XRP prediction 2025 – 2030
    • XLM prediction 2025 – 2030
    • BNB prediction 2025 – 2030
    • ADA prediction 2025 – 2030
    • AVAX prediction 2025 – 2030
    • KAS prediction 2025 – 2030
    • NEAR prediction 2025 – 2030
    • BCH prediction 2025 – 2030
    • LINK prediction 2025 – 2030
    • DOT prediction 2025 – 2030
    • SUI prediction 2025 – 2030
    • ICP prediction 2025 – 2030
    • LTC prediction 2025 – 2026
    • STX prediction 2025 – 2030
    • DOGE prediction 2025 – 2030
    • SHIB prediction 2025 – 2030
    • PEPE prediction 2025 – 2030
    • FLOKI prediction 2025 – 2030
    • WIF prediction 2025 – 2030
    • ONDO prediction 2025 – 2030
  • News
    • Crypto news
    • Commodities
  • Login
Investing Haven
No Result
View All Result

Home » Reading markets » Market Outlook 2017 According To Our Proprietary Indicators

Market Outlook 2017 According To Our Proprietary Indicators

Taki T. by Taki T.
November 28, 2023
in Reading markets
market outlook 2017
2k
VIEWS
Share on FacebookShare on Twitter

It was quite a volatile year, with a mix of collapses and rallies across markets. Think of gold’s breathtaking rise, crude’s collapse, and copper’s rally. After the summer, gold started collapsing while crude and stocks rallied strongly. With this year’s volatility, it is quite challenging to define a market outlook for 2017. To get a sense of what 2017 will bring, we analyze our proprietary market barometer and our leading market indicator.

The problem with many financial media outlets is that their market outlook sections contain so much and diverse information that it becomes an impossibility it to utilize that info for forecasting. Take as an example the market outlook section on CNBC or the Financial Times. Both are not really useful. That is why we developed a simple and straightforward methodology based one proprietary market barometer and one leading indicator.

Our proprietary market barometer

First, our market barometer looks at all leading markets, and gives a sense of intermarket dynamics. The point in this is that markets do not move in a vacuum, they move in relation to each other. For instance, early this year, gold rallied strongly as a sign of fear; consequently, crude and stocks tanked. Gold’s rally stalled when stocks started rallying. It is important to look at market trends as a function of each other.

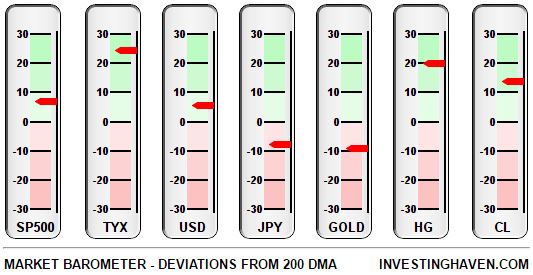
Our market barometer displays the deviation of 7 leading markets from their 200 day moving average (DMA). A market trading above its 200 DMA is bullish and in a long term uptrend, a market below its 200 DMA is bearish and in a downtrend. The key challenge of our market barometer is to identify primary market trends based on how leading markets are moving against each other.

Right now, risk assets are in a bullish mode: stocks, yields, copper and crude are all in a long term uptrend. On the other hand, gold and the Japanese Yen, both fear assets, are in a long term downtrend.

market outlook 2017

‘Risk on’ market outlook 2017 based on this leading indicator

The market barometer reflects the state of markets at a given point in time. But is it fair to say that the ‘risk on’ trend will continue into the first half of 2017?

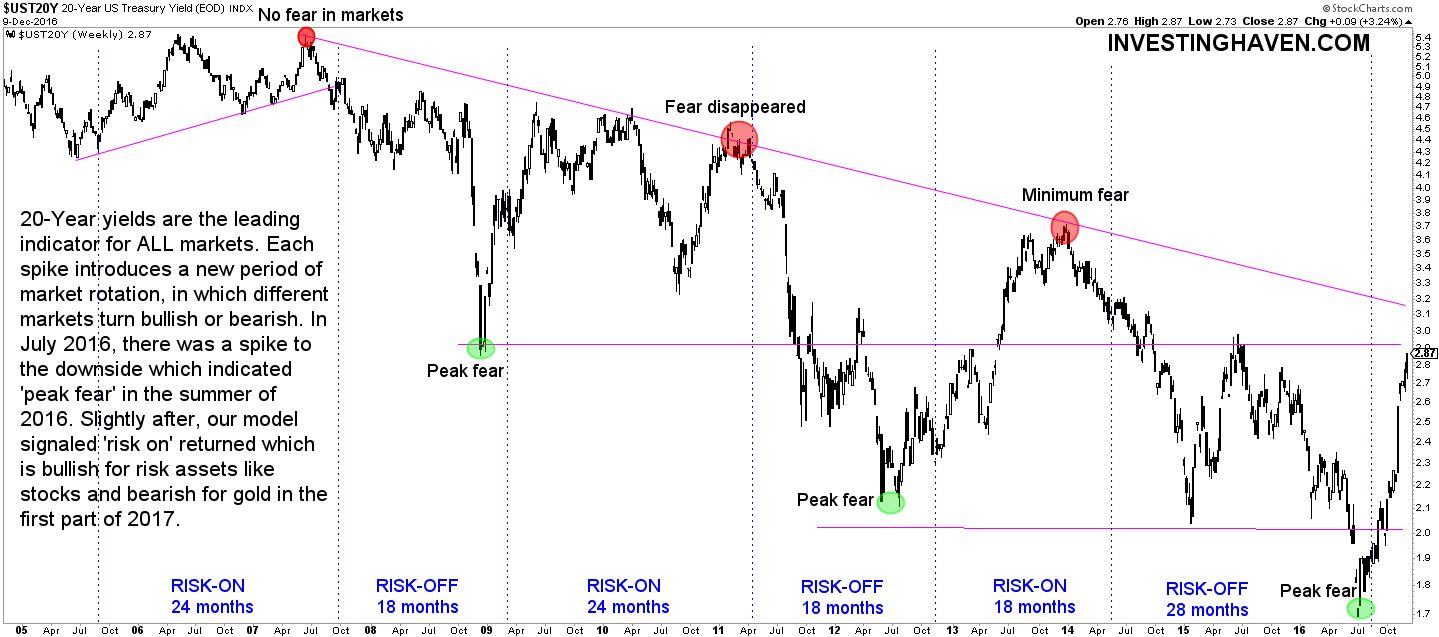
To answer that question, we look at our leading indicator: 20 year treasury yields. The next chart makes the point that 20 year yields introduce a new phase in markets (risk on vs risk off) exactly at times when extreme high or low fear levels coincide with peaks and bottoms on its long term chart (see red and green circles on the chart).

Right after the Brexit vote, 20 year yields bottomed, at a time of maximum fear, and most investors were expecting a stock market crash. That was a turning point for risk, and, since then, risk assets started outperforming fear assets. Stock markets broke to all-time highs, copper and crude rallied, while gold sold off.

With our leading indicator suggesting risk is on, we expect this trend to continue into the first part of 2017. As of the summer, our expectation is that stock markets will start correcting, potentially very sharply. Bonds will become attractive at that point, in line with our former bond market outlook, while commodities will certainly not be attractive.

When it comes to gold, it is too hard to make a prediction. If gold continues to behave as a fear asset, we expect gold to turn into a long term uptrend. The challenge with gold is that it has two faces. On the one hand, it is a fear asset. On the other hand, it is an inflation/deflation driven asset. Gold’s prospects always need to be assessed in the context of what other markets are doing. Initially, our gold price forecast remains bearish. We will need to re-evaluate towards the summer of 2017, and make a new call based on intermarket dynamics.

market outlook 2017

10-YEAR ANNIVERSARY OFFER: InvestingHaven.com celebrates 10 years. Temporarily, you can enjoy a discount on our premium gold/silver and crypto reports. Or you can become a VIP member. Go to our anniversary deals >>
Receive our weekly newsletter.

premium service SP-500 premium service trade alerts premium service crypto teaser 

No related posts.

Tags: 2017 ForecastsGOLDJPYSPXUS DollarUSO
Taki T.

Taki T.

Taki is a chart analyst who is passionate about unlocking unique insights out the chart. While the vast majority of analysts remain focused on price analysis, Taki starts with timeline analysis and adds price analysis to this. In doing so, he developed a unique methodology to find opportunities in financial markets, across assets and markets.

Leave a Reply Cancel reply

Your email address will not be published. Required fields are marked *

Connect with InvestingHaven

Receive top notch forecasts for free.

*We hate spam as you do.

Site Navigation

  • RSS Feed
  • About us
  • Advertising
  • Sponsored Content Policy
  • Mission 2026
  • Sitemap
  • Privacy & Disclaimer
  • Terms of Service
  • Contact Us
investing haven logo

Precious metals market analysis including gold and silver price predictions. Crypto market analysis including highly accurate BTC ETH SOL XRP forecasts.

Copyright © 2025 InvestingHaven

Login to your account below

Forgotten Password?

Fill the forms bellow to register

All fields are required. Log In

Retrieve your password

Please enter your username or email address to reset your password.

Log In

Receive top notch forecasts for free.

*We hate spam as you do.

No Result
View All Result
  • News
  • 2025 Forecasts
    • 10 market predictions
    • Dow Jones forecast 2025
    • S&P 500 forecast 2025
    • Nasdaq prediction 2025
    • Best crypto to buy now
    • Which crypto will explode
    • Best altcoins to buy
    • 15 crypto forecasts 2025
    • Which precious metal to buy
  • Silver articles
    • Silver prediction 2025 – 2030
    • Will silver exceed $30?
    • When will silver hit $50?
    • Can silver hit $100?
    • Silver shortage
    • 50-year silver chart
    • Silver bullish reversal
    • Silver seasonality charts
    • How to invest in silver
  • Gold
    • Gold prediction 2025 – 2030
    • Will gold set new ATH?
    • Will gold hit $3,000?
    • Can gold hit $10,000?
    • Gold chart 10 years
    • Gold chart 50 years
    • Gold chart 100 years
    • Gold silver ratio
    • Gold seasonality charts
  • Commodities
    • Sugar forecasts
    • Coffee forecasts
    • Nickel forecasts
    • Lithium investing
  • Crypto news
  • Crypto forecasts
    • BTC prediction 2025 – 2030
    • ETH prediction 2025 – 2030
    • SOL prediction 2025 – 2030
    • XRP prediction 2025 – 2030
    • XLM prediction 2025 – 2030
    • BNB prediction 2025 – 2030
    • ADA prediction 2025 – 2030
    • AVAX prediction 2025 – 2030
    • KAS prediction 2025 – 2030
    • NEAR prediction 2025 – 2030
    • BCH prediction 2025 – 2030
    • LINK prediction 2025 – 2030
    • DOT prediction 2025 – 2030
    • SUI prediction 2025 – 2030
    • ICP prediction 2025 – 2030
    • LTC prediction 2025 – 2026
    • STX prediction 2025 – 2030
    • DOGE prediction 2025 – 2030
    • SHIB prediction 2025 – 2030
    • PEPE prediction 2025 – 2030
    • FLOKI prediction 2025 – 2030
    • WIF prediction 2025 – 2030
    • ONDO prediction 2025 – 2030
  • Premium Crypto Alerts
  • Premium services

Copyright © 2025 InvestingHaven