Investing Haven
No Result
View All Result
Gold Silver Investing >>
CRYPTO INVESTING >>
  • 2025 Forecasts
    • 10 market predictions
    • Dow Jones forecast
    • S&P 500 forecast 2025
    • Nasdaq prediction 2025
    • Best altcoins to buy
    • Best crypto to buy now
    • Which crypto will explode
    • 15 crypto forecasts 2025
    • Which precious metal to buy
  • Silver
    • Silver prediction 2025 – 2030
    • Will silver exceed $30?
    • When will silver hit $50?
    • Can silver hit $100?
    • Silver shortage
    • 50-year silver chart
    • Silver bullish reversal
    • Silver seasonality charts
    • How to invest in silver
  • Gold
    • Gold prediction 2025 – 2030
    • Will gold set new ATH?
    • Will gold hit $3,000?
    • Can gold hit $10,000?
    • Gold chart 10 years
    • Gold chart 50 years
    • Gold chart 100 years
    • Gold silver ratio
    • Gold seasonality charts
  • Commodities
    • Coffee forecasts
    • Sugar forecasts
    • Nickel forecasts
    • Lithium investing
  • Crypto forecasts
    • BTC prediction 2025 – 2030
    • ETH prediction 2025 – 2030
    • SOL prediction 2025 – 2030
    • XRP prediction 2025 – 2030
    • XLM prediction 2025 – 2030
    • BNB prediction 2025 – 2030
    • ADA prediction 2025 – 2030
    • AVAX prediction 2025 – 2030
    • KAS prediction 2025 – 2030
    • NEAR prediction 2025 – 2030
    • BCH prediction 2025 – 2030
    • LINK prediction 2025 – 2030
    • DOT prediction 2025 – 2030
    • SUI prediction 2025 – 2030
    • ICP prediction 2025 – 2030
    • LTC prediction 2025 – 2026
    • STX prediction 2025 – 2030
    • DOGE prediction 2025 – 2030
    • SHIB prediction 2025 – 2030
    • PEPE prediction 2025 – 2030
    • FLOKI prediction 2025 – 2030
    • WIF prediction 2025 – 2030
    • ONDO prediction 2025 – 2030
  • News
    • Crypto news
    • Commodities
  • Login
Investing Haven
No Result
View All Result

Home » Reading markets » Markets 101: Volatility Ahead for Stock Markets?

Markets 101: Volatility Ahead for Stock Markets?

Taki T. by Taki T.
May 31, 2018
in Reading markets
volatility
2.1k
VIEWS
Share on FacebookShare on Twitter

The VIX Index, paired with the readings from the TED Spread, can provide interesting insight on stock markets’s strength. This article looks at the chart of both indicators in order to derive a conclusion of what it means for stock markets.

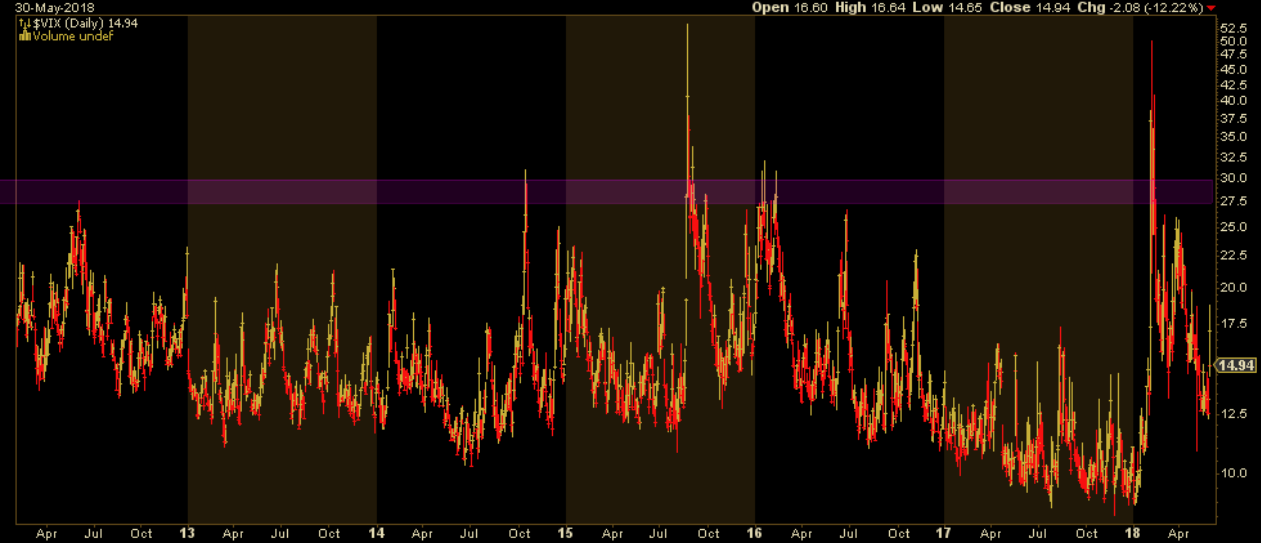
The VIX Chart Shows Lower Volatility is back

After historically low volatility levels in 2017, the VIX came back in full force on February 2018 where a mega spike in the VIX index took everyone by surprise.

Since then, it got rejected at the important resistance area of 27 to go lower from there. We also noted the recent bounce off of the support in the 12.5 area. While we might not see the low volatility levels from 2017 anytime soon, it is possible the pattern of lower lows from 2015 to 2017 might happen again.

The Vix’s current levels and chart leads us to believe that investors sentiment is positive and corroborates our positive outlook for the US Stock market. However, we do not recommend looking into the VIX alone to understand or assess the risk appetite in the Stock market as that could be very misleading for investors. That why we consider the VIX’s level in parallel with other top indicators in our InvestingHaven intermarket analysis. The next indicator we will cover today is TED Spread.

ViX

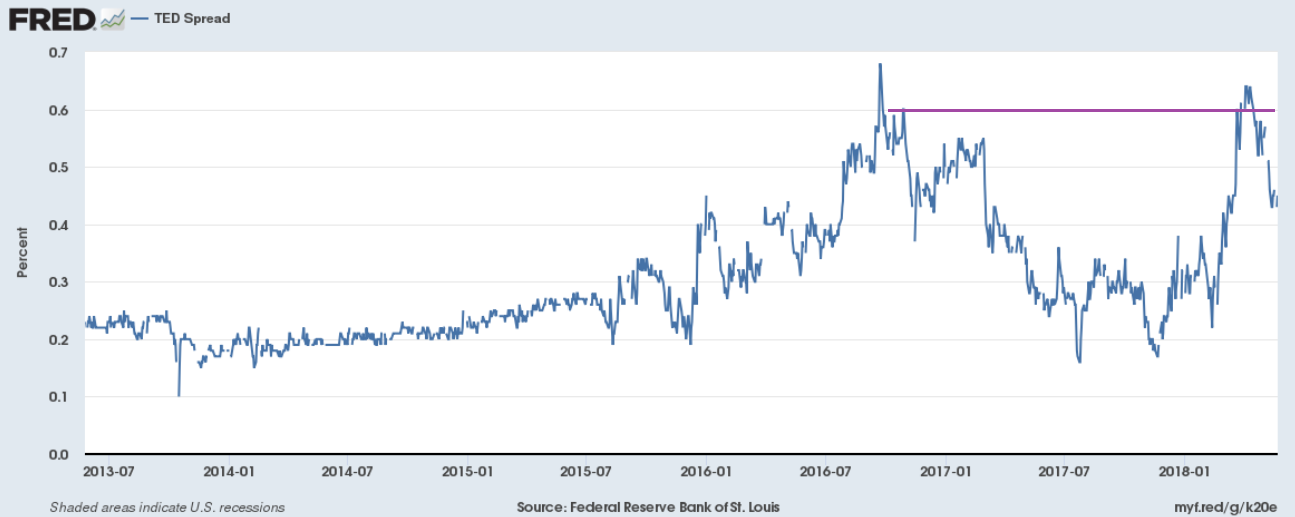
The TED Spread Declining and Approaching an Important Support Area

The Ted spread, around the same time as the VIX, got rejected at a major resistance area around the 0.6 level. And just like the VIX, it is currently in a support area around the 0.4 level. This is very interesting because both got rejected around the same time which is Bullish for stock markets, however, since they are both at or approaching major support areas, we might see a sideways movement which will result in volatility in the US Stock market (and a global ripple effect).

On the other hand, if the support levels we mentioned above fail, this could trigger a massive risk on period with low volatility in which stocks will outperform.

In short, we have an interesting setup in the VIX and Ted Spread where if the both bounce off support simultaneously, we might witness important volatility in the stock market. If both supports fail simultaneously, another strong risk on period with low volatility could follow.

And when it comes to risk on Vs Risk off, our leading indicator remains the Japanese Yen, which is the 3rd indicator we will cover in this article.

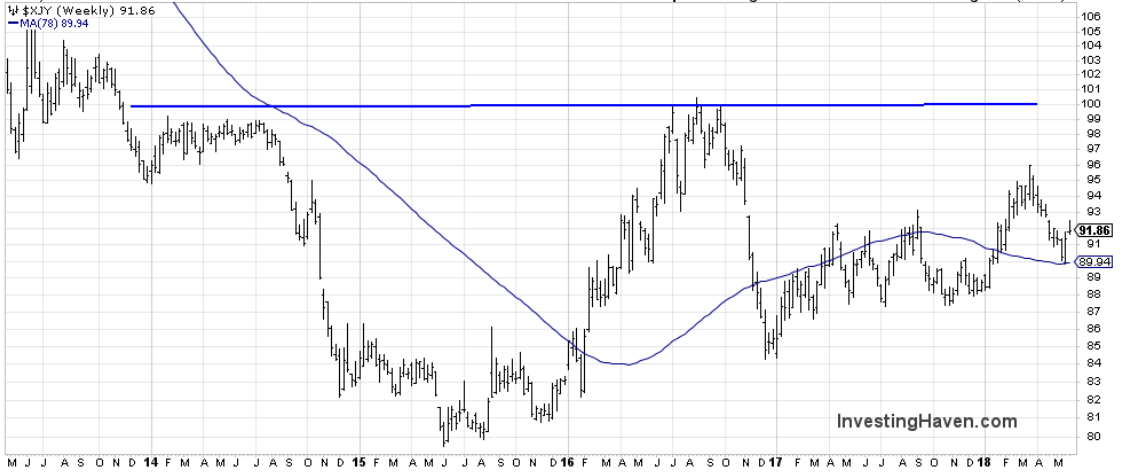
The Japanese YEN Remains Well Supported

This is a very important indicators to watch and gauge investors sentiment. With all the media coverage of the North Korean summit and everything happening in the world, it is easy for even seasoned investors to be blurred by the noise. However, with the Yen, it is relatively easy to remain objective by sticking to the chart: Over 100 USD, the overall investors’ sentiment is bearish, Below 100, it’s risk on. As simple as that.

So if investors see a spike in the VIX , an increased Ted Spread along with the YEN crossing above 100 USD, a full blown Risk off period might be ahead. This remains an unlikely scenario for now but still, one to watch for and that would invalidate our positive outlook for US Stocks.

To conclude, when looking at the volatility levels in the US Stock market, the TED spread that indicates the potential for higher / lower financing cost and increased / decreased access to credit as well as the Japanese Yen, which we consider a number one indicator of investors’ fear, we maintain our positive stance on the US stock market but do not exclude volatility ahead.

The price levels we have included in this article are important levels investors need to watch to react quickly to the next market movements. Ideally, smart investors should have their top picks ready to be able to capitalize on whatever movement the market makes.

10-YEAR ANNIVERSARY OFFER: InvestingHaven.com celebrates 10 years. Temporarily, you can enjoy a discount on our premium gold/silver and crypto reports. Or you can become a VIP member. Go to our anniversary deals >>
Receive our weekly newsletter.

premium service SP-500 premium service trade alerts premium service crypto teaser 

No related posts.

Tags: tedVIX Volatility IndexYEN
Taki T.

Taki T.

Taki is a chart analyst who is passionate about unlocking unique insights out the chart. While the vast majority of analysts remain focused on price analysis, Taki starts with timeline analysis and adds price analysis to this. In doing so, he developed a unique methodology to find opportunities in financial markets, across assets and markets.

Leave a Reply Cancel reply

Your email address will not be published. Required fields are marked *

Connect with InvestingHaven

Receive top notch forecasts for free.

*We hate spam as you do.

Site Navigation

  • RSS Feed
  • About us
  • Advertising
  • Sponsored Content Policy
  • Mission 2026
  • Sitemap
  • Privacy & Disclaimer
  • Terms of Service
  • Contact Us
investing haven logo

Precious metals market analysis including gold and silver price predictions. Crypto market analysis including highly accurate BTC ETH SOL XRP forecasts.

Copyright © 2025 InvestingHaven

Login to your account below

Forgotten Password?

Fill the forms bellow to register

All fields are required. Log In

Retrieve your password

Please enter your username or email address to reset your password.

Log In

Receive top notch forecasts for free.

*We hate spam as you do.

No Result
View All Result
  • News
  • 2025 Forecasts
    • 10 market predictions
    • Dow Jones forecast 2025
    • S&P 500 forecast 2025
    • Nasdaq prediction 2025
    • Best crypto to buy now
    • Which crypto will explode
    • Best altcoins to buy
    • 15 crypto forecasts 2025
    • Which precious metal to buy
  • Silver articles
    • Silver prediction 2025 – 2030
    • Will silver exceed $30?
    • When will silver hit $50?
    • Can silver hit $100?
    • Silver shortage
    • 50-year silver chart
    • Silver bullish reversal
    • Silver seasonality charts
    • How to invest in silver
  • Gold
    • Gold prediction 2025 – 2030
    • Will gold set new ATH?
    • Will gold hit $3,000?
    • Can gold hit $10,000?
    • Gold chart 10 years
    • Gold chart 50 years
    • Gold chart 100 years
    • Gold silver ratio
    • Gold seasonality charts
  • Commodities
    • Sugar forecasts
    • Coffee forecasts
    • Nickel forecasts
    • Lithium investing
  • Crypto news
  • Crypto forecasts
    • BTC prediction 2025 – 2030
    • ETH prediction 2025 – 2030
    • SOL prediction 2025 – 2030
    • XRP prediction 2025 – 2030
    • XLM prediction 2025 – 2030
    • BNB prediction 2025 – 2030
    • ADA prediction 2025 – 2030
    • AVAX prediction 2025 – 2030
    • KAS prediction 2025 – 2030
    • NEAR prediction 2025 – 2030
    • BCH prediction 2025 – 2030
    • LINK prediction 2025 – 2030
    • DOT prediction 2025 – 2030
    • SUI prediction 2025 – 2030
    • ICP prediction 2025 – 2030
    • LTC prediction 2025 – 2026
    • STX prediction 2025 – 2030
    • DOGE prediction 2025 – 2030
    • SHIB prediction 2025 – 2030
    • PEPE prediction 2025 – 2030
    • FLOKI prediction 2025 – 2030
    • WIF prediction 2025 – 2030
    • ONDO prediction 2025 – 2030
  • Premium Crypto Alerts
  • Premium services

Copyright © 2025 InvestingHaven